中国水稻科学 ›› 2021, Vol. 35 ›› Issue (6): 573-585.DOI: 10.16819/j.1001-7216.2021.210110
李杰1, 田蓉蓉1, 白天亮1, 朱春艳1, 宋佳伟1, 田蕾1,*( ), 马帅国1,2, 吕建东1, 胡慧1, 王震宇1, 罗成科1, 张银霞1, 李培富1
收稿日期:2021-01-12
修回日期:2021-03-20
出版日期:2021-11-10
发布日期:2021-11-10
通讯作者:
田蕾
基金资助:
Jie LI1, Rongrong TIAN1, Tianliang BAI1, Chunyan ZHU1, Jiawei SONG1, Lei TIAN1,*(), Shuaiguo MA1,2, Jiandong LÜ1, Hui HU1, Zhenyu WANG1, Chengke LUO1, Yinxia ZHANG1, Peifu LI1
Received:2021-01-12
Revised:2021-03-20
Online:2021-11-10
Published:2021-11-10
Contact:
Lei TIAN
摘要:
【目的】通过对水稻剑叶性状的综合评价,明确剑叶相关性状间及与6个农艺性状的关系。检测剑叶相关性状的QTL,为优良株型品种选育,剑叶性状基因的精细定位和克隆奠定基础。【方法】以日本优质粳稻品种越光和葡萄牙粳稻地方种Bertone构建的回交群体两个世代为实验材料,利用BC3F1群体基因型构建遗传连锁图谱;测定亲本和BC3F2群体各株系剑叶SPAD、剑叶长、剑叶宽,计算剑叶长宽比、剑叶面积;利用隶属函数和标准差系数赋予权重法获得剑叶性状综合评价值(D值),分析其与6个农艺性状间的关系。分别利用单标记分析(SPA)和区间作图(IM)检测水稻剑叶相关性状QTL。【结果】在抽穗灌浆期,两亲本剑叶SPAD值呈现先升高后降低的动态变化。BC3F2群体的5个剑叶相关性状变异丰富,总体表现趋向轮回亲本越光。4个剑叶形态性状间相关性均达到极显著水平,与剑叶SPAD的相关性不显著。主成分和逐步线性回归分析表明剑叶宽、剑叶SPAD、剑叶长、剑叶面积是影响剑叶综合评价值(D值)的主要因子。高D值株系的株高、穗长、茎基粗和单株产量均极显著高于低D值株系,两者的分蘖数和有效穗数差异不显著。共检测到18个控制剑叶性状的QTL,分布在水稻第1、4、7和8染色体上,贡献率分布范围为4.00%~28.00%(SPA)和3.41%~27.00%(IM),除qFLSPAD1之外的17个QTL增效基因均来自Bertone。在第8染色体上的RM22720-RM404区间发现1个QTL簇,含6个主效QTL,分别为qFLL8.1、qFLL8.2、qFLA8.1、qFLA8.2、qD8.1和qD8.2。【结论】获得了剑叶宽、剑叶SPAD、剑叶长和剑叶面积4个评价剑叶性状的关键指标;明确了剑叶性状与单株产量之间的正相关关系;检测到18个剑叶相关性状QTL,位于第8染色体RM22720-RM404区间的QTL簇,是影响剑叶性状的1个重要染色体区域。
李杰, 田蓉蓉, 白天亮, 朱春艳, 宋佳伟, 田蕾, 马帅国, 吕建东, 胡慧, 王震宇, 罗成科, 张银霞, 李培富. 水稻回交群体剑叶性状综合评价及QTL定位[J]. 中国水稻科学, 2021, 35(6): 573-585.
Jie LI, Rongrong TIAN, Tianliang BAI, Chunyan ZHU, Jiawei SONG, Lei TIAN, Shuaiguo MA, Jiandong LÜ, Hui HU, Zhenyu WANG, Chengke LUO, Yinxia ZHANG, Peifu LI. Comprehensive Evaluation and QTL Analysis for Flag Leaf Traits Using a Backcross Population in Rice[J]. Chinese Journal OF Rice Science, 2021, 35(6): 573-585.
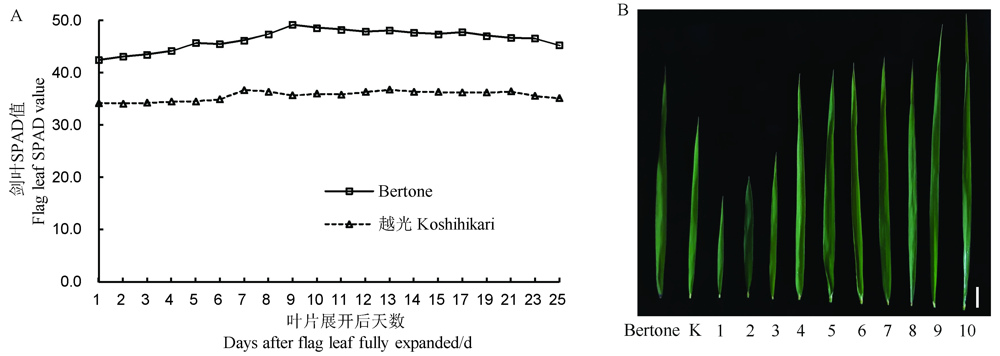
图1 亲本及BC3F2群体剑叶性状表现 A–2018年Bertone和越光剑叶SPAD值动态变化;B–亲本和BC3F2代表性株系的剑叶形态学特征。K-越光;1~10表示10个BC3F2代表性株系;竖线代表5 cm。
Fig. 1. Flag leaf traits of parents and BC3F2 population. A, Dynamic changes in SPAD values of flag leaf of Bertone and Koshihikari in 2018; B, Morphological traits of flag leaf of parents and representative lines of BC3F2. K, Koshihikari; 1-10, Representative lines of BC3F2; Vertical lines represent 5 cm.
| 性状 Trait | 亲本 Parent | 世代 Generation | 群体参数 Parameter of two populations | ||||||
|---|---|---|---|---|---|---|---|---|---|
| 越光Koshihikari | Bertone | 均值±标准差 Mean±SD | 分布范围 Range | 变异系数 CV/% | 峰度 Kurtosis | 偏度 Skewness | |||
| 剑叶SPAD FLSPAD | 35.67 | 44.06** | BC3F1 | 41.16±3.60 | 32.40~52.50 | 8.75 | 0.18 | 0.31 | |
| BC3F2 | 36.40±2.71 | 30.40~49.00 | 7.31 | 2.49 | 1.07 | ||||
| 剑叶长 FLL/cm | 29.28 | 35.38* | BC3F1 | 30.16±5.18 | 15.83~44.53 | 17.18 | -0.02 | -0.24 | |
| BC3F2 | 27.76±2.94 | 20.80~40.75 | 10.59 | 2.54 | 0.92 | ||||
| 剑叶宽 FLW/cm | 1.21 | 1.80** | BC3F1 | 1.20±0.14 | 0.80~1.57 | 11.67 | 0.42 | -0.30 | |
| BC3F2 | 1.21±0.08 | 1.00~2.00 | 5.00 | 45.09 | 5.13 | ||||
| 剑叶长宽比 FLWR | 24.20 | 19.66* | BC3F1 | 25.30±4.43 | 13.61~42.10 | 17.51 | 1.24 | 0.60 | |
| BC3F2 | 23.07±2.43 | 16.00~33.96 | 10.64 | 1.66 | 0.45 | ||||
| 剑叶面积FLA/cm2 | 26.57 | 47.76** | BC3F1 | 27.32±6.23 | 9.50~46.27 | 22.80 | 0.11 | -0.31 | |
| BC3F2 | 25.15±3.67 | 17.66~54.53 | 12.81 | 17.77 | 2.85 | ||||
表1 越光和Bertone及其两个回交群体5个剑叶性状表现
Table 1 Performance of five flag leaf traits of Koshihikari, Bertone and two backcross populations.
| 性状 Trait | 亲本 Parent | 世代 Generation | 群体参数 Parameter of two populations | ||||||
|---|---|---|---|---|---|---|---|---|---|
| 越光Koshihikari | Bertone | 均值±标准差 Mean±SD | 分布范围 Range | 变异系数 CV/% | 峰度 Kurtosis | 偏度 Skewness | |||
| 剑叶SPAD FLSPAD | 35.67 | 44.06** | BC3F1 | 41.16±3.60 | 32.40~52.50 | 8.75 | 0.18 | 0.31 | |
| BC3F2 | 36.40±2.71 | 30.40~49.00 | 7.31 | 2.49 | 1.07 | ||||
| 剑叶长 FLL/cm | 29.28 | 35.38* | BC3F1 | 30.16±5.18 | 15.83~44.53 | 17.18 | -0.02 | -0.24 | |
| BC3F2 | 27.76±2.94 | 20.80~40.75 | 10.59 | 2.54 | 0.92 | ||||
| 剑叶宽 FLW/cm | 1.21 | 1.80** | BC3F1 | 1.20±0.14 | 0.80~1.57 | 11.67 | 0.42 | -0.30 | |
| BC3F2 | 1.21±0.08 | 1.00~2.00 | 5.00 | 45.09 | 5.13 | ||||
| 剑叶长宽比 FLWR | 24.20 | 19.66* | BC3F1 | 25.30±4.43 | 13.61~42.10 | 17.51 | 1.24 | 0.60 | |
| BC3F2 | 23.07±2.43 | 16.00~33.96 | 10.64 | 1.66 | 0.45 | ||||
| 剑叶面积FLA/cm2 | 26.57 | 47.76** | BC3F1 | 27.32±6.23 | 9.50~46.27 | 22.80 | 0.11 | -0.31 | |
| BC3F2 | 25.15±3.67 | 17.66~54.53 | 12.81 | 17.77 | 2.85 | ||||
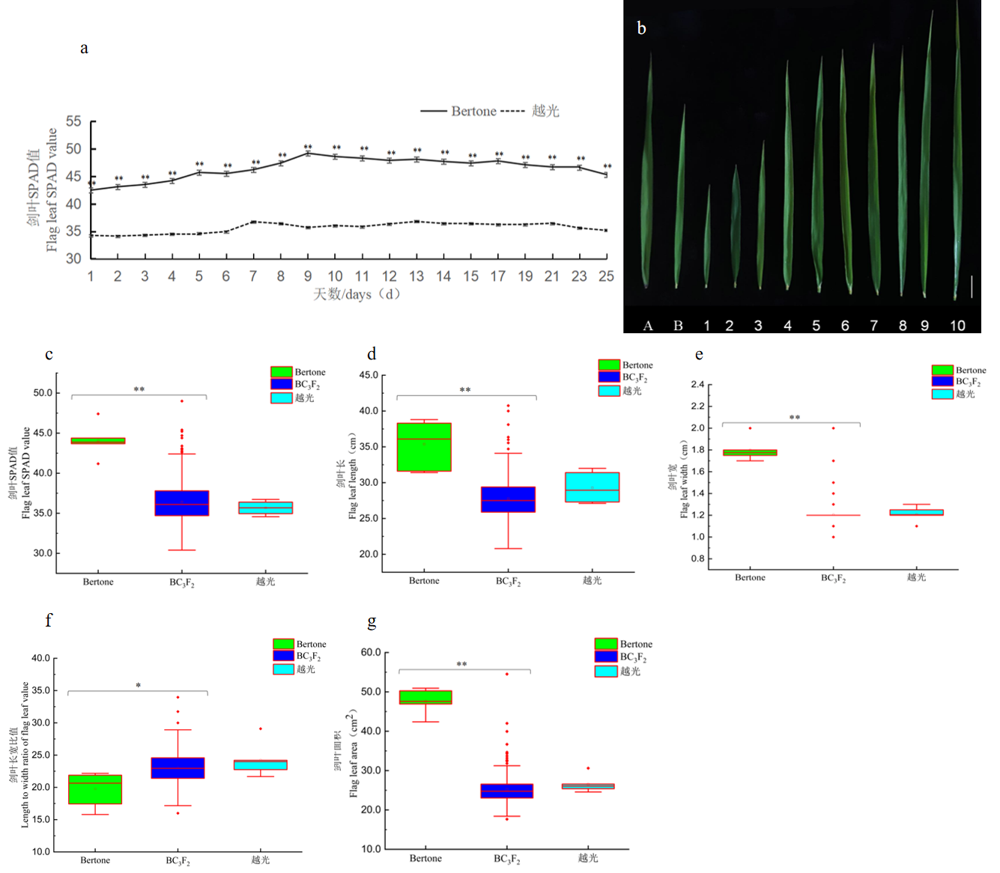
图S1 亲本及BC3F2群体剑叶性状表现a:2018年Bertone和越光剑叶SPAD值动态变化;b:亲本和BC3F2代表性家系的剑叶形态学特征;c~g: 亲本及BC3F2群体剑叶SPAD、剑叶长、剑叶宽、剑叶长宽比和剑叶面积的箱线图; A: Bertone;B:越光;1~10:10个BC3F2代表性家系;竖线代表5 cm;*表示0.05水平差异显著;**表示0.01水平差异显著;下同
Fig. S1 Parents and BC3F2 population flag leaf characteristicsa: Dynamic changes of SPAD values of Bertone and Koshihikari flag leaf in 2018; b:Morphological characteristics of flag leaf of parents and representative lines of BC3F2; c~g: Boxplots of flag leaf SPAD, flag leaf length, flag leaf width, length to width ratio of flag leaf and flag leaf area of parents and BC3F2 populations ; A: Bertone; B: Koshihikari; 1~10: 10 representative lines of BC3F2; Vertical lines represent 5 cm; *Significant at P<0.05; **Significant at P<0.01; The same as below.
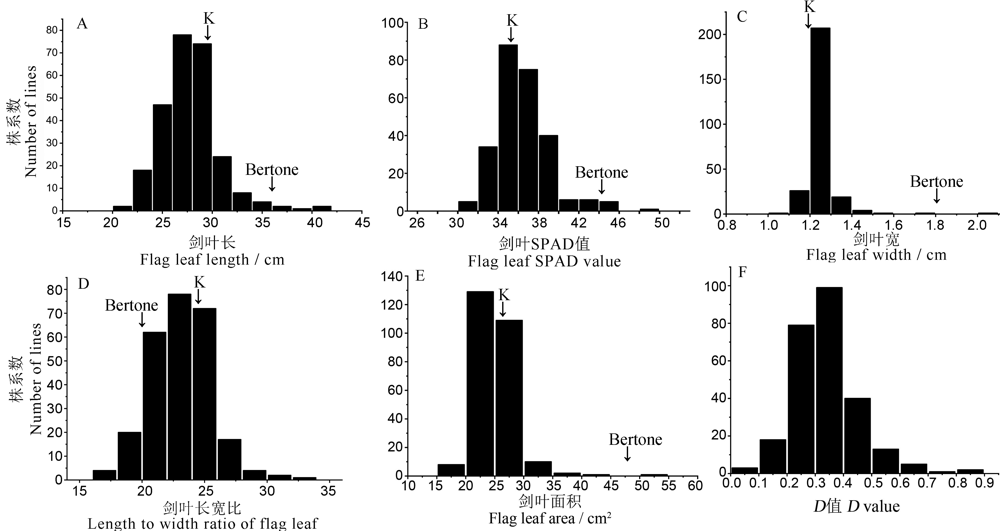
图2 BC3F2群体5个剑叶相关性状及综合评价值(D值)的频率分布 K代表越光。K,Koshihikari.
Fig. 2. Distribution of five flag leaf-related traits and comprehensive evaluation (D value) for BC3F2 population.
| 性状 Trait | 剑叶SPAD FLSPAD | 剑叶长 FLL | 剑叶宽 FLW | 剑叶长宽比 FLWR |
|---|---|---|---|---|
| 剑叶长 Flag leaf length | 0.089 | |||
| 剑叶宽 Flag leaf width | 0.052 | 0.190** | ||
| 剑叶长宽比 Length to width ratio of flag leaf | 0.069 | 0.897** | -0.259** | |
| 剑叶面积 Flag leaf area | 0.094 | 0.913** | 0.569** | 0.641** |
表2 BC3F2群体剑叶性状间相关性分析
Table 2 Correlation analysis on flag leaf traits in BC3F2 population.
| 性状 Trait | 剑叶SPAD FLSPAD | 剑叶长 FLL | 剑叶宽 FLW | 剑叶长宽比 FLWR |
|---|---|---|---|---|
| 剑叶长 Flag leaf length | 0.089 | |||
| 剑叶宽 Flag leaf width | 0.052 | 0.190** | ||
| 剑叶长宽比 Length to width ratio of flag leaf | 0.069 | 0.897** | -0.259** | |
| 剑叶面积 Flag leaf area | 0.094 | 0.913** | 0.569** | 0.641** |
| 性状 Trait | CI1 | CI2 | CI3 |
|---|---|---|---|
| 剑叶SPAD Flag leaf SPAD | 0.147 | 0.092 | 0.985 |
| 剑叶长 Flag leaf length | 0.991 | -0.123 | -0.046 |
| 剑叶宽 Flag leaf width | 0.306 | 0.948 | -0.082 |
| 剑叶长宽比 Length to width ratio of flag leaf | 0.838 | -0.545 | -0.004 |
| 剑叶面积 Flag leaf area | 0.954 | 0.288 | -0.074 |
| 特征值 Eigenvalue | 2.709 | 1.302 | 0.984 |
| 贡献率 Contribution / % | 54.171 | 26.043 | 19.683 |
| 累计贡献率Cumulative contribution / % | 54.171 | 80.214 | 99.897 |
表3 5个剑叶性状3个主成分的载荷值、特征值及贡献率
Table 3 Load value, eigenvalue and contribution rate of three principal components of five flag leaf traits.
| 性状 Trait | CI1 | CI2 | CI3 |
|---|---|---|---|
| 剑叶SPAD Flag leaf SPAD | 0.147 | 0.092 | 0.985 |
| 剑叶长 Flag leaf length | 0.991 | -0.123 | -0.046 |
| 剑叶宽 Flag leaf width | 0.306 | 0.948 | -0.082 |
| 剑叶长宽比 Length to width ratio of flag leaf | 0.838 | -0.545 | -0.004 |
| 剑叶面积 Flag leaf area | 0.954 | 0.288 | -0.074 |
| 特征值 Eigenvalue | 2.709 | 1.302 | 0.984 |
| 贡献率 Contribution / % | 54.171 | 26.043 | 19.683 |
| 累计贡献率Cumulative contribution / % | 54.171 | 80.214 | 99.897 |
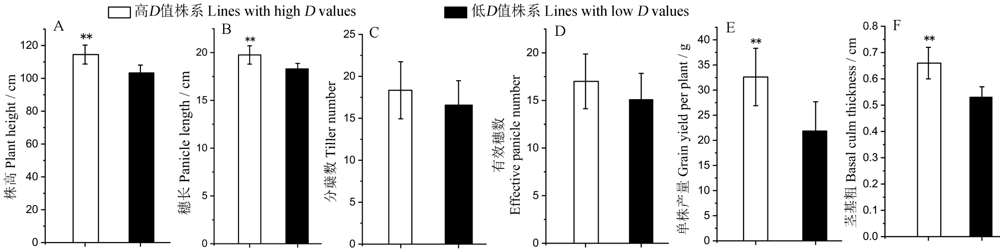
图3 高、低剑叶综合评价值(D值)株系6个农艺性状表现
Fig. 3. Six agronomic traits of BC3F2 lines with high and low comprehensive evaluation value (D value).
| 性状 Trait | 剑叶SPAD FLSPAD | 剑叶长 FLL | 剑叶宽 FLW | 长宽比 FLWR | 剑叶面积 FLA | D值 D value | 株高 PH | 穗长 PL | 分蘖数 TN | 有效穗数 EP | 单株产量 YPP |
|---|---|---|---|---|---|---|---|---|---|---|---|
| 剑叶长FLL | 0.456* | 1.000 | |||||||||
| 剑叶宽FLW | 0.206 | 0.438* | 1.000 | ||||||||
| 剑叶长宽比FLWR | 0.422* | 0.889** | -0.015 | 1.000 | |||||||
| 剑叶面积FLA | 0.417* | 0.930** | 0.735** | 0.663** | 1.000 | ||||||
| D值 D value | 0.594** | 0.934** | 0.683** | 0.697** | 0.978** | 1.000 | |||||
| 株高PH | 0.455* | 0.699** | 0.377* | 0.606** | 0.670** | 0.702** | 1.000 | ||||
| 穗长PL | 0.449* | 0.776** | 0.350 | 0.697** | 0.726** | 0.748** | 0.653** | 1.000 | |||
| 分蘖数TN | 0.321 | 0.264 | 0.159 | 0.202 | 0.252 | 0.300 | 0.177 | -0.010 | 1.000 | ||
| 有效穗数EP | 0.260 | 0.290 | 0.222 | 0.203 | 0.299 | 0.327 | 0.187 | 0.036 | 0.963** | 1.000 | |
| 单株产YPP | 0.478** | 0.598** | 0.525** | 0.422* | 0.649** | 0.686** | 0.526** | 0.451* | 0.666** | 0.720** | 1.000 |
| 茎基粗BCT | 0.502** | 0.825** | 0.513** | 0.675** | 0.823** | 0.847** | 0.797** | 0.750** | 0.228 | 0.254 | 0.680** |
表4 高、低D值株系剑叶相关性状与农艺性状的相关系数矩阵
Table 4 Correlation matrix of flag leaf-related traits and agronomic traits in BC3F2 lines with high and low D values.
| 性状 Trait | 剑叶SPAD FLSPAD | 剑叶长 FLL | 剑叶宽 FLW | 长宽比 FLWR | 剑叶面积 FLA | D值 D value | 株高 PH | 穗长 PL | 分蘖数 TN | 有效穗数 EP | 单株产量 YPP |
|---|---|---|---|---|---|---|---|---|---|---|---|
| 剑叶长FLL | 0.456* | 1.000 | |||||||||
| 剑叶宽FLW | 0.206 | 0.438* | 1.000 | ||||||||
| 剑叶长宽比FLWR | 0.422* | 0.889** | -0.015 | 1.000 | |||||||
| 剑叶面积FLA | 0.417* | 0.930** | 0.735** | 0.663** | 1.000 | ||||||
| D值 D value | 0.594** | 0.934** | 0.683** | 0.697** | 0.978** | 1.000 | |||||
| 株高PH | 0.455* | 0.699** | 0.377* | 0.606** | 0.670** | 0.702** | 1.000 | ||||
| 穗长PL | 0.449* | 0.776** | 0.350 | 0.697** | 0.726** | 0.748** | 0.653** | 1.000 | |||
| 分蘖数TN | 0.321 | 0.264 | 0.159 | 0.202 | 0.252 | 0.300 | 0.177 | -0.010 | 1.000 | ||
| 有效穗数EP | 0.260 | 0.290 | 0.222 | 0.203 | 0.299 | 0.327 | 0.187 | 0.036 | 0.963** | 1.000 | |
| 单株产YPP | 0.478** | 0.598** | 0.525** | 0.422* | 0.649** | 0.686** | 0.526** | 0.451* | 0.666** | 0.720** | 1.000 |
| 茎基粗BCT | 0.502** | 0.825** | 0.513** | 0.675** | 0.823** | 0.847** | 0.797** | 0.750** | 0.228 | 0.254 | 0.680** |
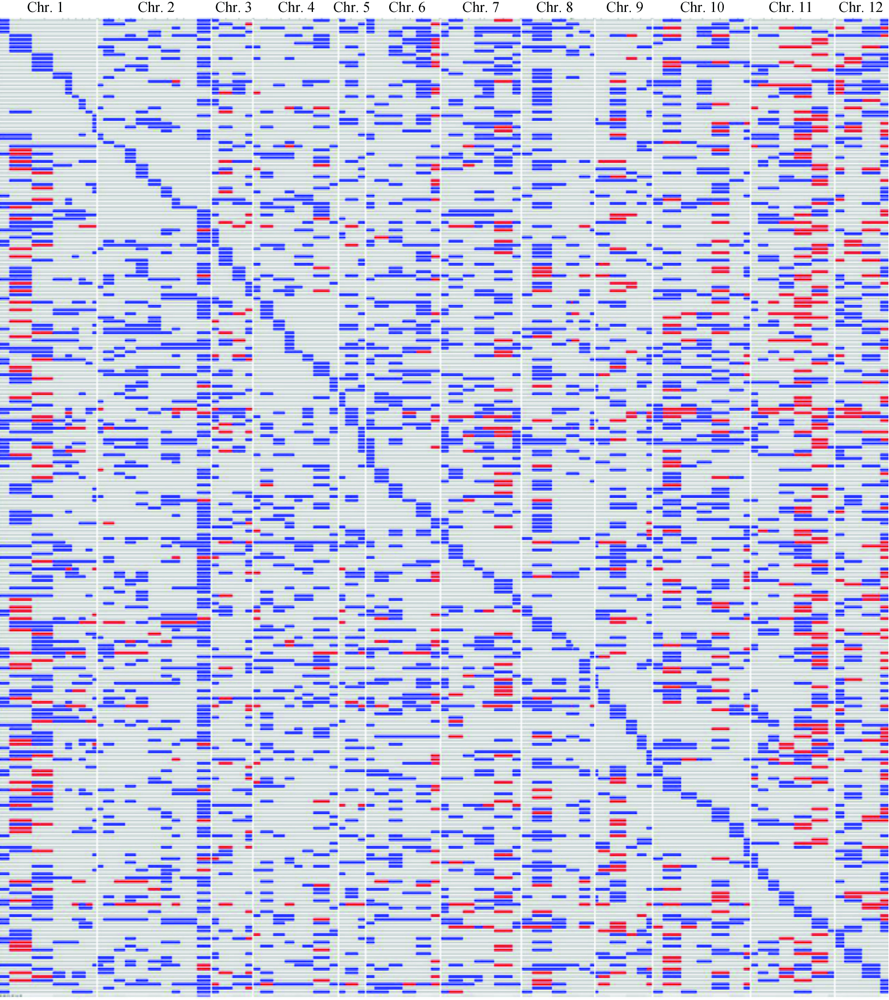
图4 以粳稻品种越光为遗传背景的Bertone渗入系全基因组图示基因型蓝色区域,杂合基因型;红色区域,Bertone纯合基因型;灰白色区域,越光纯合基因型。
Fig. 4. Graphical genotypes of the 260 BC3F1 lines of Bertone with Koshihikari genetic background. The blue regions indicate the heterozygous genotype; the red regions indicate the homozygous genotype of Bertone; the gray regions indicate the homozygous genotype of Koshihikari.
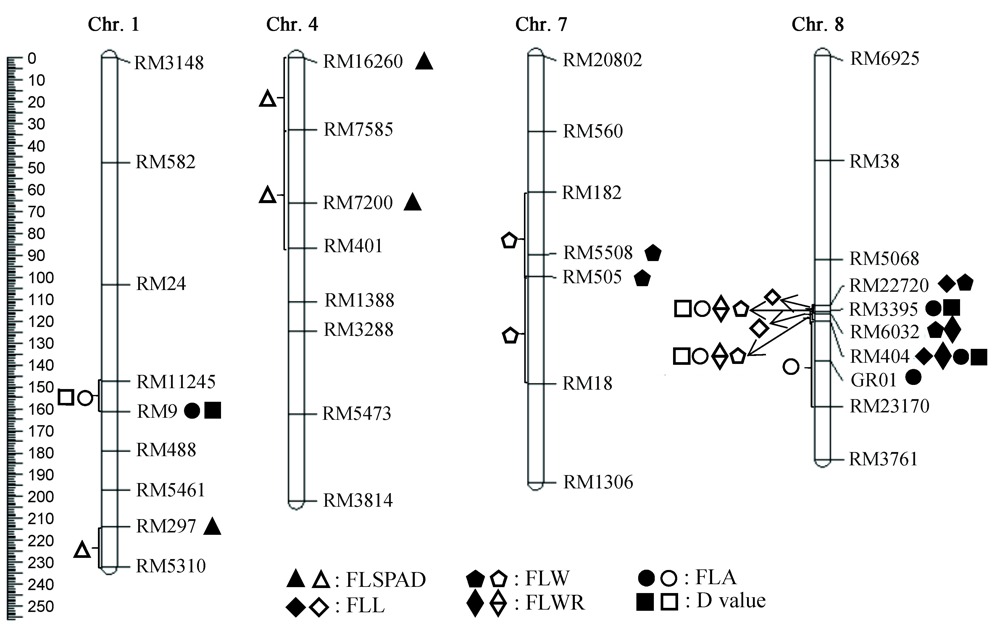
图5 BC3F1群体剑叶相关性状QTL在水稻染色体上的位置和分布实心符号表示SPA检测到的QTL;空心符号表示IM检测到的QTL。
Fig. 5. Location and the distribution of QTLs for flag leaf related traits in BC3F1 population on chromosomes in rice. Solid symbol represents the QTL to which SPA is legally assigned;Hollow symbol represents the QTL to which IM is legally assigned.
| QTL | 染色体Chromosome | 位置 Position /cM | 标记 Marker | 标记区间 Marker interval | 单标记分析SPA | 区间作图IM | ||||||
|---|---|---|---|---|---|---|---|---|---|---|---|---|
| LOD | 贡献率PVE/% | 加性效应 Add | LOD | 贡献率PVE/% | 加性效应 Add | 文献 Reference | ||||||
| qFLSPAD1 | 1 | 213.8 | RM297 | RM297—RM5310 | 3.91 | 7.00 | 1.51 | 3.16 | 5.57 | 1.21 | [35] | |
| qFLSPAD4.1 | 4 | 0.0 | RM16260 | RM16260—RM7585 | 4.17 | 7.00 | -1.39 | 2.81 | 5.00 | -1.18 | ||
| qFLSPAD4.2 | 4 | 66.2 | RM7200 | RM7585—RM401 | 9.91 | 17.00 | -2.83 | 4.47 | 7.69 | -1.46 | ||
| qFLL8.1 | 8 | 115.0 | RM22720 | RM22720—RM3395 | 11.65 | 19.00 | -3.63 | 11.61 | 19.00 | -3.50 | ||
| qFLL8.2 | 8 | 122.3 | RM404 | RM3395—RM404 | 12.26 | 20.00 | -3.44 | 11.29 | 18.00 | -3.15 | ||
| qFLW7.1 | 7 | 91.7 | RM5508 | RM182—RM505 | 2.53 | 4.00 | -0.03 | 2.02 | 3.41 | -0.02 | [26] | |
| qFLW7.2 | 7 | 101.7 | RM505 | RM5508—RM18 | 4.24 | 7.00 | -0.03 | 2.60 | 4.41 | -0.03 | [42] | |
| qFLW8.1 | 8 | 115.0 | RM22720 | RM22720—RM6032 | 9.74 | 16.00 | -0.07 | 9.11 | 14.83 | -0.06 | ||
| qFLW8.2 | 8 | 118.8 | RM6032 | RM6032—RM404 | 6.59 | 11.00 | -0.05 | 6.71 | 11.20 | -0.05 | ||
| qFLWR8.1 | 8 | 118.8 | RM6032 | RM22720—RM6032 | 4.22 | 7.00 | -1.65 | 3.70 | 6.33 | -1.64 | ||
| qFLWR8.2 | 8 | 122.3 | RM404 | RM6032—RM404 | 5.15 | 9.00 | -1.92 | 4.16 | 7.20 | -1.67 | ||
| qFLA1 | 1 | 161.1 | RM9 | RM11245—RM488 | 3.74 | 6.00 | -1.60 | 2.38 | 4.17 | -1.30 | ||
| qFLA8.1 | 8 | 117.7 | RM3395 | RM22720—RM6032 | 18.26 | 28.00 | -3.96 | 17.78 | 27.00 | -4.43 | ||
| qFLA8.2 | 8 | 122.3 | RM404 | RM6032—RM404 | 16.00 | 25.00 | -4.24 | 15.53 | 24.20 | -4.05 | ||
| qFLA8.3 | 8 | 140.8 | GR01 | RM404—RM23170 | 2.63 | 5.00 | -1.41 | 4.33 | 7.26 | -1.75 | ||
| qD1 | 1 | 161.1 | RM9 | RM11245—RM488 | 4.17 | 7.00 | -0.06 | 2.53 | 4.35 | -0.05 | ||
| qD8.1 | 8 | 117.7 | RM3395 | RM22720—RM6032 | 16.70 | 26.00 | -0.14 | 16.77 | 25.50 | -0.16 | ||
| qD8.2 | 8 | 122.3 | RM404 | RM6032—RM404 | 14.72 | 23.00 | -0.15 | 14.89 | 23.20 | -0.14 | ||
表5 两种方法定位到的水稻剑叶相关性状QTL
Table 5 QTL for traits related to flag leaf of rice detected by two methods.
| QTL | 染色体Chromosome | 位置 Position /cM | 标记 Marker | 标记区间 Marker interval | 单标记分析SPA | 区间作图IM | ||||||
|---|---|---|---|---|---|---|---|---|---|---|---|---|
| LOD | 贡献率PVE/% | 加性效应 Add | LOD | 贡献率PVE/% | 加性效应 Add | 文献 Reference | ||||||
| qFLSPAD1 | 1 | 213.8 | RM297 | RM297—RM5310 | 3.91 | 7.00 | 1.51 | 3.16 | 5.57 | 1.21 | [35] | |
| qFLSPAD4.1 | 4 | 0.0 | RM16260 | RM16260—RM7585 | 4.17 | 7.00 | -1.39 | 2.81 | 5.00 | -1.18 | ||
| qFLSPAD4.2 | 4 | 66.2 | RM7200 | RM7585—RM401 | 9.91 | 17.00 | -2.83 | 4.47 | 7.69 | -1.46 | ||
| qFLL8.1 | 8 | 115.0 | RM22720 | RM22720—RM3395 | 11.65 | 19.00 | -3.63 | 11.61 | 19.00 | -3.50 | ||
| qFLL8.2 | 8 | 122.3 | RM404 | RM3395—RM404 | 12.26 | 20.00 | -3.44 | 11.29 | 18.00 | -3.15 | ||
| qFLW7.1 | 7 | 91.7 | RM5508 | RM182—RM505 | 2.53 | 4.00 | -0.03 | 2.02 | 3.41 | -0.02 | [26] | |
| qFLW7.2 | 7 | 101.7 | RM505 | RM5508—RM18 | 4.24 | 7.00 | -0.03 | 2.60 | 4.41 | -0.03 | [42] | |
| qFLW8.1 | 8 | 115.0 | RM22720 | RM22720—RM6032 | 9.74 | 16.00 | -0.07 | 9.11 | 14.83 | -0.06 | ||
| qFLW8.2 | 8 | 118.8 | RM6032 | RM6032—RM404 | 6.59 | 11.00 | -0.05 | 6.71 | 11.20 | -0.05 | ||
| qFLWR8.1 | 8 | 118.8 | RM6032 | RM22720—RM6032 | 4.22 | 7.00 | -1.65 | 3.70 | 6.33 | -1.64 | ||
| qFLWR8.2 | 8 | 122.3 | RM404 | RM6032—RM404 | 5.15 | 9.00 | -1.92 | 4.16 | 7.20 | -1.67 | ||
| qFLA1 | 1 | 161.1 | RM9 | RM11245—RM488 | 3.74 | 6.00 | -1.60 | 2.38 | 4.17 | -1.30 | ||
| qFLA8.1 | 8 | 117.7 | RM3395 | RM22720—RM6032 | 18.26 | 28.00 | -3.96 | 17.78 | 27.00 | -4.43 | ||
| qFLA8.2 | 8 | 122.3 | RM404 | RM6032—RM404 | 16.00 | 25.00 | -4.24 | 15.53 | 24.20 | -4.05 | ||
| qFLA8.3 | 8 | 140.8 | GR01 | RM404—RM23170 | 2.63 | 5.00 | -1.41 | 4.33 | 7.26 | -1.75 | ||
| qD1 | 1 | 161.1 | RM9 | RM11245—RM488 | 4.17 | 7.00 | -0.06 | 2.53 | 4.35 | -0.05 | ||
| qD8.1 | 8 | 117.7 | RM3395 | RM22720—RM6032 | 16.70 | 26.00 | -0.14 | 16.77 | 25.50 | -0.16 | ||
| qD8.2 | 8 | 122.3 | RM404 | RM6032—RM404 | 14.72 | 23.00 | -0.15 | 14.89 | 23.20 | -0.14 | ||
| [1] | 李可, 禹晴, 徐云姬, 杨建昌. 水稻叶片早衰突变体的农艺与生理性状研究进展[J]. 中国水稻科学, 2020, 34(2): 104-114. |
| Li K, Yu Q, Xu Y J, Yang J C.Research progress in agronomic and physiological traits of early leaf senescence mutants in rice[J]. Chinese Journal of Rice Science, 2020, 34(2): 104-114. (in Chinese with English abstract) | |
| [2] | Lü W K, Hu H, He L P, Zhang X C, Ou X X, Chen H Y, Yu S B, Xu J L, Qiu X J, Li Z X, Xu J Y, Wang X Y, Liu Z Y, Wang C R, Jiang J F, Lou J.Characterization and fine mapping of two white panicle genes with duplicated effect in rice[J]. International Journal of Agriculture and Biology, 2018, 20: 2805-2811. |
| [3] | 童汉华, 梅捍卫, 邢永忠, 曹一平, 余新桥, 章善庆, 罗利军. 水稻生育后期剑叶形态和生理特性的QTL定位[J]. 中国水稻科学, 2007, 21(5): 493-499. |
| Tong H H, Mei H W, Xing Y Z, Cao Y P, Yu X Q, Zhang S Q, Luo L J.QTL analysis for morphological and physiological characteristics of flag leaf at the late developmental stage in rice[J]. Chinese Journal of Rice Science, 2007, 21(5): 493-499. (in Chinese with English abstract) | |
| [4] | Zhang B, Ye W J, Ren D Y, Tian P, Peng Y L, Gao Y, Ruan B P, Wang L, Zhang G H, Guo L B, Qian Q, Gao Z Y.Genetic analysis of flag leaf size and candidate genes determination of a major QTL for flag leaf width in rice[J]. Rice, 2015, 8(1):1-10. |
| [5] | Shen B, Yu W D, Zhu Y J, Fan Y Y, Zhuang J Y.Fine mapping of a major quantitative trait locus, qFLL6.2, controlling flag leaf length and yield traits in rice (Oryza sativa L.)[J]. Euphytica, 2012, 184(1): 57-64. |
| [6] | 朱双兵, 吕文恺, 何丽萍, 邢丹英, 杨隆维, 邱先进, 徐建龙. 全基因组关联分析解析水稻剑叶及单株产量的遗传基础[J]. 植物遗传资源学报, 2020, 21(3): 663-673. |
| Zhu S B, Lü W K, He L P, Xing D Y, Yang L W, Qiu X J, Xu J L.Genetic dissection of flag leaf related traits and grain yield per plant using genome-wide association analysis[J]. Journal of Plant Genetic Resources, 2020, 21(3): 663-673. (in Chinese with English abstract) | |
| [7] | Ye W J, Hu S K, Wu L W, Ge C W, Cui Y T, Chen P, Xu J, Dong G J, Guo L B, Qian Q.Fine mapping a major QTL qFCC7L for chlorophyll content in rice (Oryza sativa L.) cv. PA64s[J]. Plant Growth Regulation, 2017, 81(1): 81-90. |
| [8] | 周勇, 陶亚军, 姚锐, 李畅, 谭文琛, 裔传灯, 龚志云, 梁国华. 利用染色体片段代换系定位水稻叶片形态性状QTL[J]. 作物学报, 2017, 43(11): 1650-1657. |
| Zhou Y, Tao Y J, Yao R, Li C, Tan W C, Yi C D, Gong Z Y, Liang G H.QTL mapping for leaf morphological traits of rice using chromosome segment substitution lines[J]. Acta Agronomica Sinica, 2017, 43(11): 1650-1657. (in Chinese with English abstract) | |
| [9] | 胡娟, 林晗, 徐娜, 焦然, 戴志俊, 鲁草林, 饶玉春, 王跃星. 水稻叶倾角分子机制及育种应用的研究进展[J]. 中国水稻科学, 2019, 33(5): 391-400. |
| Hu J, Lin H, Xu N, Jiao R, Dai Z J, Lu C L, Rao Y C, Wang Y X.Advances in molecular mechanisms of rice leaf inclination and its application in breeding[J]. Chinese Journal of Rice Science, 2019, 33(5): 391-400. (in Chinese with English abstract) | |
| [10] | 朱长丰, 梁利君, 曾思远, 李天伟, 董冠杉, 洪德林. 水稻剑叶角度qFla-8-2位点的精细定位[J]. 中国水稻科学, 2016, 30(1): 27-34. |
| Zhu C F, Liang L J, Zeng S Y, Li T W, Dong G S, Hong D L.Fine mapping of qFla-8-2 for flag leaf angle in rice[J]. Chinese Journal of Rice Science, 2016, 30(1): 27-34. (in Chinese with English abstract) | |
| [11] | 张孝波, 谢佳, 张晓琼, 田维江, 何沛龙, 刘思岑, 何光华, 钟秉强, 桑贤春. 水稻矮化剑叶卷曲突变体dcfl1的鉴定与基因精细定位[J]. 中国农业科学, 2017, 50(9): 1551-1558. |
| Zhang X B, Xie J, Zhang X Q, Tian W J, He P L, Liu S C, He G H, Zhong B Q, Sang X C.Identification and gene mapping of a dwarf and curled flag leaf mutant dcfl1 in rice[J]. Scientia Agricultura Sinica, 2017, 50(9): 1551-1558. (in Chinese with English abstract) | |
| [12] | 阿加拉铁, 曾龙军, 薛大伟, 胡江, 曾大力, 高振宇, 郭龙彪, 李仕贵, 钱前. 水稻灌浆期不同阶段叶绿素含量的QTL分析[J]. 作物学报, 2008, 34(1): 61-66. |
| A J L T, Zeng L J, Xue D W, Hu J, Zeng D L, Gao Z Y, Guo L B, Li S G, Qian Q. QTL analysis for chlorophyll content in four grain-filling stage in rice[J]. Acta Agronomica Sinica, 2008, 34(1): 61-66. (in Chinese with English abstract) | |
| [13] | 周丽慧, 赵春芳, 赵凌, 张亚东, 朱镇, 陈涛, 赵庆勇, 姚姝, 于新, 王才林. 利用染色体片段置换系群体检测水稻叶片形态QTL[J]. 中国水稻科学, 2013, 27(1): 26-34. |
| Zhou L H, Zhao C F, Zhao L, Zhang Y D, Zhu Z, Chen T, Zhao Q Y, Yao S, Yu X, Wang C L.QTL detection for leaf morphology of rice using chromosome segment substitution lines[J]. Chinese Journal of Rice Science, 2013, 27(1): 26-34. (in Chinese with English abstract) | |
| [14] | 张强, 陈凯, 梁云涛, 章禄标, 郑天清, 徐建龙, 张文忠, 黎志康. 利用双向导入系剖析水稻源、库相关性状的QTL[J]. 核农学报, 2013, 27(3): 261-271. |
| Zhang Q, Chen K, Liang Y T, Zhang L B, Zheng T Q, Xu J L, Zhang W Z, Li Z K.QTL mapping of sink-source related traits using two sets of reciprocal introgression lines in rice[J]. Journal of Nuclear Agricultural Sciences, 2013, 27(3): 261-271. (in Chinese with English abstract) | |
| [15] | 王兰, 黄李超, 代丽萍, 杨窑龙, 徐杰, 冷语佳, 张光恒, 胡江, 朱丽, 高振宇, 董国军, 郭龙彪, 钱前, 曾大力. 利用日本晴/9311重组自交系群体定位水稻成熟期叶形相关性状QTL[J]. 中国水稻科学, 2014, 28(6): 589-597. |
| Wang L, Huang L C, Dai L P, Yang Y L, Xu J, Leng Y J, Zhang G H, Hu J, Zhu L, Gao Z Y, Dong G J, Guo L B, Qian Q, Zeng D L.QTL analysis for rice leaf morphology at maturity stage using a recombinant inbred line population derived from a cross between Nipponbare and 9311[J]. Chinese Journal of Rice Science, 2014, 28(6): 589-597. (in Chinese with English abstract) | |
| [16] | 彭伟业, 孙平勇, 潘素君, 李魏, 戴良英. 水稻品种魔王谷粒形、剑叶性状和株高QTL定位[J]. 作物学报, 2018, 44(11): 1673-1680. |
| Peng W Y, Sun P Y, Pan S J, Li W, Dai L Y.Mapping QTLs for grain shape, flag leaf traits, and plant height in rice variety Mowanggu[J]. Acta Agronomica Sinica, 2018, 44(11): 1673-1680. (in Chinese with English abstract) | |
| [17] | Chen M L, Luo J, Shao G N, Wei X J, Tang S Q, Sheng Z H, Song J, Hu P S.Fine mapping of a major QTL for flag leaf width in rice, qFLW4 , which might be caused by alternative splicing of NAL1[J]. Plant Cell Reports, 2012, 31(5): 863-872. |
| [18] | Farooq M, Tagle A G, Santos R E, Ebron L A, Kobayashi N.Quantitative trait loci mapping for leaf length and leaf width in rice cv. IR64 derived lines[J]. Journal of Integrative Plant Biology, 2010, 52(6): 578-584. |
| [19] | Tian Y H, Zhang H Y, Xu P Z, Chen X Q, Liao Y X, Han B L, Chen X B, Fu X D, Wu X J.Genetic mapping of a QTL controlling leaf width and grain number in rice[J]. Euphytica, 2015, 202(1): 1-11. |
| [20] | Bian J M, He H H, Shi H, Zhu G Q, Li C J, Zhu C L, Peng X S, Yu Q Y, Fu J R, He X P, Chen X R, Hu L F, Lin J, Ou-Yang L J. Quantitative trait loci mapping for flag leaf traits in rice using a chromosome segment substitution line population[J]. Plant Breeding, 2014, 133(2): 203-209. |
| [21] | Wang P, Zhou G L, Yu H H, Yu S B.Fine mapping a major QTL for flag leaf size and yield-related trait in rice[J]. Theoretical and Applied Genetics, 2011, 123: 1319-1330. |
| [22] | 谈聪, 翁小煜, 鄢文豪, 白旭峰, 邢永忠. 多效性基因Ghd7调控水稻剑叶面积[J]. 遗传, 2012, 34(7): 901-906. |
| Tan C, Weng X Y, Yan W H, Bai X F, Xing Y Z.Ghd7, a pleiotropic gene controlling flag leaf area in rice[J]. Hereditas(Beijing), 2012, 34(7): 901-906. (in Chinese with English abstract) | |
| [23] | 穆平, 李自超, 李春平, 张洪亮, 王象坤. 水、旱条件下水稻茎秆主要抗倒伏性状的QTL分析[J]. 遗传学报, 2004(7): 717-723. |
| Mu P, Li Z C, Li C P, Zhang H L, Wang X K.QTL analysis for lodging resistance in rice using a DH population under lowland and upland ecosystems[J]. Acta Genetica Sinica, 2004(7): 717-723. (in Chinese with English abstract) | |
| [24] | 田蕾, 陈亚萍, 刘俊, 马晓刚, 王娜, 杨兵, 李莹, 郭海东, 李娟, 胡慧, 张银霞, 李培富. 粳稻种质资源芽期耐盐性综合评价与筛选[J]. 中国水稻科学, 2017, 31(6): 631-642. |
| Tian L, Chen Y P, Liu J, Ma X G, Wang N, Yang B, Li Y, Guo H D, Li J, Hu H, Zhang Y X, Li P F.Comprehensive evaluation and selection of rice (Oryza sativa japonica) germplasm for saline tolerance at germination stage[J]. Chinese Journal of Rice Science, 2017, 31(6): 631-642. (in Chinese with English abstract) | |
| [25] | 王小雷, 李炜星, 曾博虹, 孙晓棠, 欧阳林娟, 陈小荣, 贺浩华, 朱昌兰. 基于染色体片段置换系对水稻粒形及千粒重QTL检测与稳定性分析[J]. 作物学报, 2020, 46(10): 1517-1525. |
| Wang X L, Li W X, Zeng B H, Sun X T, Ou-Yang L J, Chen X R, He H H, Zhu C L. QTL detection and stability analysis of rice grain shape and thousand-grain weight based on chromosome segment substitution lines[J]. Acta Agronomica Sinica, 2020, 46(10): 1517-1525. (in Chinese with English abstract) | |
| [26] | 张玲, 李晓楠, 王伟, 杨生龙, 李清, 王嘉宇. 水稻株型相关性状的QTL分析[J]. 作物学报, 2014, 40(12): 2128-2135. |
| Zhang L, Li X N, Wang W, Yang S L, Li Q, Wang J Y.Analysis of QTLs for plant type traits in rice (Oryza sativa)[J]. Acta Agronomica Sinica, 2014, 40(12): 2128-2135. (in Chinese with English abstract) | |
| [27] | Fu Q, Zhang P J, Tan L B, Zhu Z F, Ma D, Fu Y C, Zhan X C, Cai H W, Sun C Q.Analysis of QTLs for yield-related traits in Yuanjiang common wild rice (Oryza rufipogon Griff.)[J]. Journal of Genetics and Genomics, 2010, 37(2): 147-157. |
| [28] | McCouch S R. Gene nomenclature system for rice[J]. Rice, 2008, 1(1): 72-84. |
| [29] | 顾骏飞, 周振翔, 李志康, 戴琪星, 孔祥胜, 王志琴, 杨建昌. 水稻低叶绿素含量突变对光合作用及产量的影响[J]. 作物学报, 2016, 42(4): 551-560. |
| Gu J F, Zhou Z X, Li Z K, Dai Q X, Kong X S, Wang Z Q, Yang J C.Effects of the mutant with low chlorophyll content on photosynthesis and yield in rice[J]. Acta Agronomica Sinica, 2016, 42(4): 551-560. (in Chinese with English abstract) | |
| [30] | Takai T, Kondo M, Yano M, Yamamoto T.A quantitative trait locus for chlorophyll content and its association with leaf photosynthesis in rice[J]. Rice, 2010, 3(2): 172-180. |
| [31] | 殷延勃, 马洪文. 粳稻剑叶不同发育时期SPAD值遗传效应分析[J]. 西北农业学报, 2008, 17(5): 171-173, 193. |
| Yin Y B, Ma H W.Analysis of genetic effects at different growth stages SPAD values in flag leaf of paddy rice[J]. Acta Agriculturae Boreali-occidentalis Sinica, 2008, 17(5): 171-173, 193. (in Chinese with English abstract) | |
| [32] | Huang L C, Dai L P, Wang L, Leng Y J, Yang Y L, Xu J, Hu J, Rao Y C, Zhang G H, Zhu L, Dong G J, Guo L B, Qian Q, Zeng D L.Genetic dissection for chlorophyll content of the top three leaves during grain filling in rice ( Oryza sativa L.)[J]. Journal of Plant Growth Regulation, 2015, 34(2): 381-391. |
| [33] | 胡茂龙, 王春明, 杨权海, 翟虎渠, 陆巍, 张荣铣, 万建民. 水稻光合功能相关性状QTL分析[J]. 遗传学报, 2005, 32(8): 818-824. |
| Hu M L, Wang C M, Yang Q H, Zhai H Q, Lu W, Zhang R X, Wan J M.QTL analysis for traits associated with photosynthetic functions in rice (Oryza sativa L. )[J]. Acta Genetica Sinica, 2005, 32(8): 818-824. (in Chinese with English abstract) | |
| [34] | 刘进, 王嘉宇, 姜树坤, 徐正进. 水稻叶绿素含量动态QTL分析[J]. 植物生理学报, 2012, 48(6): 577-583. |
| Liu J, Wang J Y, Jiang S K, Xu Z J.Detection and analysis of dynamic QTL of leaf chlorophyll content in rice (Oryza sativa L.)[J] Plant Physiology Journal, 2012, 48(6): 577-583. (in Chinese with English abstract) | |
| [35] | Yue B, Xue W Y, Luo L J, Xing Y Z.QTL analysis for flag leaf characteristics and their relationships with yield and yield traits in rice[J]. Acta Genetica Sinica, 2006, 33(9): 824-832. |
| [36] | Jiang S K, Zhang X J, Wang J Y, Chen W F, Xu Z J.Fine mapping of the quantitative trait locus qFLL9 controlling flag leaf length in rice[J]. Euphytica, 2010, 176(3): 341-347. |
| [37] | Tang X X, Gong R, Sun W Q, Zhang C P, Yu S B.Genetic dissection and validation of candidate genes for flag leaf size in rice (Oryza sativa L.)[J]. Theoretical and Applied Genetics, 2018, 131(4): 801-815. |
| [38] | Lin L H, Zhao Y F, Liu F, Chen Q, Qi J C.Narrow leaf 1 (NAL1) regulates leaf shape by affecting cell expansion in rice (Oryza sativa L.)[J]. Biochemical and Biophysical Research Communications, 2019, 516(3): 957-962. |
| [39] | Qi J, Qian Q, Bu Q Y, Li S Y, Chen Q, Sun J Q, Liang W X, Zhou Y H, Chu C C, Li X G, Ren F G, Palme K, Zhao B R, Chen J F, Chen M S, Li C Y.Mutation of the rice narrow leaf1 gene, which encodes a novel protein, affects vein patterning and polar auxin transport[J]. Plant Physiology, 2008, 147(4): 1947-1959. |
| [40] | Zhang G H, Li S Y, Wang L, Ye W J, Zeng D L, Rao Y C, Peng Y L, Hu J, Yang Y L, Xu J, Ren D Y, Gao Z Y, Zhu L, Dong G J, Hu X M, Yan M X, L, Guo L B, Li C Y, Qian Q. LSCHL4 from japonica cultivar, which is allelic to NAL1, increases yield of indica super rice 93-11[J]. Molecular Plant, 2014, 7(8): 1350-1364. |
| [41] | Xue W Y, Xing Y Z, Weng X Y, Zhao Y, Tang W J, Wang L, Zhou H J, Yu S B, Xu C G, Li X H, Zhang Q F.Natural variation in Ghd7 is an important regulator of heading date and yield potential in rice[J]. Nature Genetics, 2008, 40(6): 761-767. |
| [42] | 邵高能, 唐绍清, 罗炬, 焦桂爱, 唐傲, 胡培松. 水稻剑叶形态与稻米粒形QTL分析及相应剩余杂合体衍生群体的构建[J]. 分子植物育种, 2009, 7(1): 16-22. |
| Shao G N, Tang S Q, Luo J, Jiao G A, Tang A, Hu P S.QTL analysis for flag leaf and grain shape and populations construction derived from related residual heterozygous lines in rice[J]. Molecular Plant Breeding, 2009, 7(1): 16-22. (in Chinese with English abstract) | |
| [43] | 吴亚辉, 陶星星, 肖武名, 郭涛, 刘永柱, 王慧, 陈志强. 水稻穗部性状的QTL分析[J]. 作物学报, 2014, 40(2): 214-221. |
| Wu Y H, Tao X X, Xiao W M, Guo T, Liu Y Z, Wang H, Chen Z Q.Dissection of QTLs for panicle traits in rice (Oryza sativa)[J]. Acta Agronomica Sinica, 2014, 40(2): 214-221. (in Chinese with English abstract) | |
| [44] | Wang P, Zhou G L, Cui K H, Li Z K, Yu S B.Clustered QTL for source leaf size and yield traits in rice ( Oryza sativa L.)[J]. Molecular Breeding, 2012, 29(1): 99-113. |
| [45] | Xu F F, Huang Y, Bao J S.Identification of QTLs for agronomic traits in indica rice using an RIL population[J]. Genes Genomics, 2015, 37(10): 809-817. |
| [1] | 汪邑晨, 朱本顺, 周磊, 朱骏, 杨仲南. 光/温敏核不育系的不育机理及两系杂交稻的发展与展望 [J]. 中国水稻科学, 2024, 38(5): 463-474. |
| [2] | 许用强, 徐军, 奉保华, 肖晶晶, 王丹英, 曾宇翔, 符冠富. 水稻花粉管生长及其对非生物逆境胁迫的响应机理研究进展 [J]. 中国水稻科学, 2024, 38(5): 495-506. |
| [3] | 何勇, 刘耀威, 熊翔, 祝丹晨, 王爱群, 马拉娜, 王廷宝, 张健, 李建雄, 田志宏. 利用CRISPR/Cas9技术编辑OsOFP30基因创制水稻粒型突变体 [J]. 中国水稻科学, 2024, 38(5): 507-515. |
| [4] | 吕阳, 刘聪聪, 杨龙波, 曹兴岚, 王月影, 童毅, Mohamed Hazman, 钱前, 商连光, 郭龙彪. 全基因组关联分析(GWAS)鉴定水稻氮素利用效率候选基因 [J]. 中国水稻科学, 2024, 38(5): 516-524. |
| [5] | 杨好, 黄衍焱, 王剑, 易春霖, 石军, 谭楮湉, 任文芮, 王文明. 水稻中八个稻瘟病抗性基因特异分子标记的开发及应用 [J]. 中国水稻科学, 2024, 38(5): 525-534. |
| [6] | 杨铭榆, 陈志诚, 潘美清, 张汴泓, 潘睿欣, 尤林东, 陈晓艳, 唐莉娜, 黄锦文. 烟-稻轮作下减氮配施生物炭对水稻茎鞘同化物转运和产量 形成的影响 [J]. 中国水稻科学, 2024, 38(5): 555-566. |
| [7] | 熊家欢, 张义凯, 向镜, 陈惠哲, 徐一成, 王亚梁, 王志刚, 姚坚, 张玉屏. 覆膜稻田施用炭基肥对水稻产量及氮素利用的影响 [J]. 中国水稻科学, 2024, 38(5): 567-576. |
| [8] | 郭展, 张运波. 水稻对干旱胁迫的生理生化响应及分子调控研究进展[J]. 中国水稻科学, 2024, 38(4): 335-349. |
| [9] | 韦还和, 马唯一, 左博源, 汪璐璐, 朱旺, 耿孝宇, 张翔, 孟天瑶, 陈英龙, 高平磊, 许轲, 霍中洋, 戴其根. 盐、干旱及其复合胁迫对水稻产量和品质形成影响的研究进展[J]. 中国水稻科学, 2024, 38(4): 350-363. |
| [10] | 许丹洁, 林巧霞, 李正康, 庄小倩, 凌宇, 赖美玲, 陈晓婷, 鲁国东. OsOPR10正调控水稻对稻瘟病和白叶枯病的抗性[J]. 中国水稻科学, 2024, 38(4): 364-374. |
| [11] | 候小琴, 王莹, 余贝, 符卫蒙, 奉保华, 沈煜潮, 谢杭军, 王焕然, 许用强, 武志海, 王建军, 陶龙兴, 符冠富. 黄腐酸钾提高水稻秧苗耐盐性的作用途径分析[J]. 中国水稻科学, 2024, 38(4): 409-421. |
| [12] | 胡继杰, 胡志华, 张均华, 曹小闯, 金千瑜, 章志远, 朱练峰. 根际饱和溶解氧对水稻分蘖期光合及生长特性的影响[J]. 中国水稻科学, 2024, 38(4): 437-446. |
| [13] | 刘福祥, 甄浩洋, 彭焕, 郑刘春, 彭德良, 文艳华. 广东省水稻孢囊线虫病调查与鉴定[J]. 中国水稻科学, 2024, 38(4): 456-461. |
| [14] | 陈浩田, 秦缘, 钟笑涵, 林晨语, 秦竞航, 杨建昌, 张伟杨. 水稻根系和土壤性状与稻田甲烷排放关系的研究进展[J]. 中国水稻科学, 2024, 38(3): 233-245. |
| [15] | 缪军, 冉金晖, 徐梦彬, 卜柳冰, 王平, 梁国华, 周勇. 过量表达异三聚体G蛋白γ亚基基因RGG2提高水稻抗旱性[J]. 中国水稻科学, 2024, 38(3): 246-255. |
| 阅读次数 | ||||||
|
全文 |
|
|||||
|
摘要 |
|
|||||