中国水稻科学 ›› 2024, Vol. 38 ›› Issue (1): 81-90.DOI: 10.16819/j.1001-7216.2024.230409
杨奇欣, 赖凤香, 何佳春, 魏琪, 王渭霞, 万品俊*( ), 傅强*()
收稿日期:2023-04-27
修回日期:2023-09-15
出版日期:2024-01-10
发布日期:2024-01-16
通讯作者:
* email: 基金资助:
YANG Qixin, LAI Fengxiang, HE Jiachun, WEI Qi, WANG Weixia, WAN Pinjun*(), FU Qiang*()
Received:2023-04-27
Revised:2023-09-15
Online:2024-01-10
Published:2024-01-16
Contact:
* email: 摘要:
【目的】探究不同抗感水稻受褐飞虱胁迫的高光谱反射率曲线变化及敏感光谱差异,研究水稻植株不同部位的高光谱变化。在此基础上,采用机器学习技术建立水稻褐飞虱抗性鉴定模型,为下一步开发智能化褐飞虱抗性鉴定技术提供重要基础资料。【方法】以三个具不同褐飞虱抗感特征的水稻品种(TN1、Mudgo、RHT)为对象,分析其光谱、植被指数差异并建立抗性级别预测的随机森林模型。【结果】研究发现,褐飞虱胁迫天数与光谱反射率显著相关的波段数及差异显著的波段数随着水稻的抗性水平的上升而减少。同时,在680 nm左右,三个品种的光谱反射率与褐飞虫胁迫时间的相关性最好。植被指数分析表明, SIPI、SR605/760和PSNDb与抗性级别的相关系数绝对值要高于680 nm的结果。感虫品种TN1差异最早体现,中抗品种Mudgo其次,高抗品种RHT最后。不同部位的差异首先出现在第1叶叶片和第1叶叶鞘,然后依次为第2叶叶片和第2叶叶鞘以及第3叶叶片和第3叶叶鞘。预测模型的结果表明,全波段作为输入的模型效果比以单一植被指数SIPI 构建的随机森林模型更好,模型准确率达到85.9%。【结论】本研究反映了不同抗感水稻品种受褐飞虱危害后的高光谱变化规律与不同抗感品种和不同部位的差异,并证实了机器学习技术对水稻抗性级别的分类能力。
杨奇欣, 赖凤香, 何佳春, 魏琪, 王渭霞, 万品俊, 傅强. 不同抗感水稻品种对褐飞虱胁迫的高光谱响应特征[J]. 中国水稻科学, 2024, 38(1): 81-90.
YANG Qixin, LAI Fengxiang, HE Jiachun, WEI Qi, WANG Weixia, WAN Pinjun, FU Qiang. Hyperspectral Properties of Rice Varieties with Varying Resistance Under Brown Planthopper (Nilaparvata lugens) Infestation[J]. Chinese Journal OF Rice Science, 2024, 38(1): 81-90.
| 抗性级别 Resistance level | 稻苗受害情况 Damage to rice seedlings |
|---|---|
| 1(高抗,HR) | 第1叶轻微受害 The first leaf is slightly damaged |
| 3(抗,R) | 第1叶明显受害,叶片发黄、叶尖枯死 The first leaf is visibly affected, with yellowing leaf blade and death of the leaf tip |
| 5(中抗,MR) | 第1、2叶明显受害,叶片发黄、叶尖枯死 The 1st and 2nd leaves are visibly affected, with yellowing leaf blades and withering leaf tips |
| 7(感,S) | 第1、2、3叶明显受害,叶片发黄、叶尖枯死 The 1st, 2nd and 3rd leaves are visibly affected, with yellowing leaf blades and withering leaf tips |
| 9(高感,HS) | 稻株整体枯死 The rice plant is withering |
表1 水稻品种对褐飞虱的抗性级别评价方法(SSST法)
Table 1. Standard Seedbox Screening Technique (SSST) method is used to evaluate the resistance level of rice varieties to the brown planthopper.
| 抗性级别 Resistance level | 稻苗受害情况 Damage to rice seedlings |
|---|---|
| 1(高抗,HR) | 第1叶轻微受害 The first leaf is slightly damaged |
| 3(抗,R) | 第1叶明显受害,叶片发黄、叶尖枯死 The first leaf is visibly affected, with yellowing leaf blade and death of the leaf tip |
| 5(中抗,MR) | 第1、2叶明显受害,叶片发黄、叶尖枯死 The 1st and 2nd leaves are visibly affected, with yellowing leaf blades and withering leaf tips |
| 7(感,S) | 第1、2、3叶明显受害,叶片发黄、叶尖枯死 The 1st, 2nd and 3rd leaves are visibly affected, with yellowing leaf blades and withering leaf tips |
| 9(高感,HS) | 稻株整体枯死 The rice plant is withering |
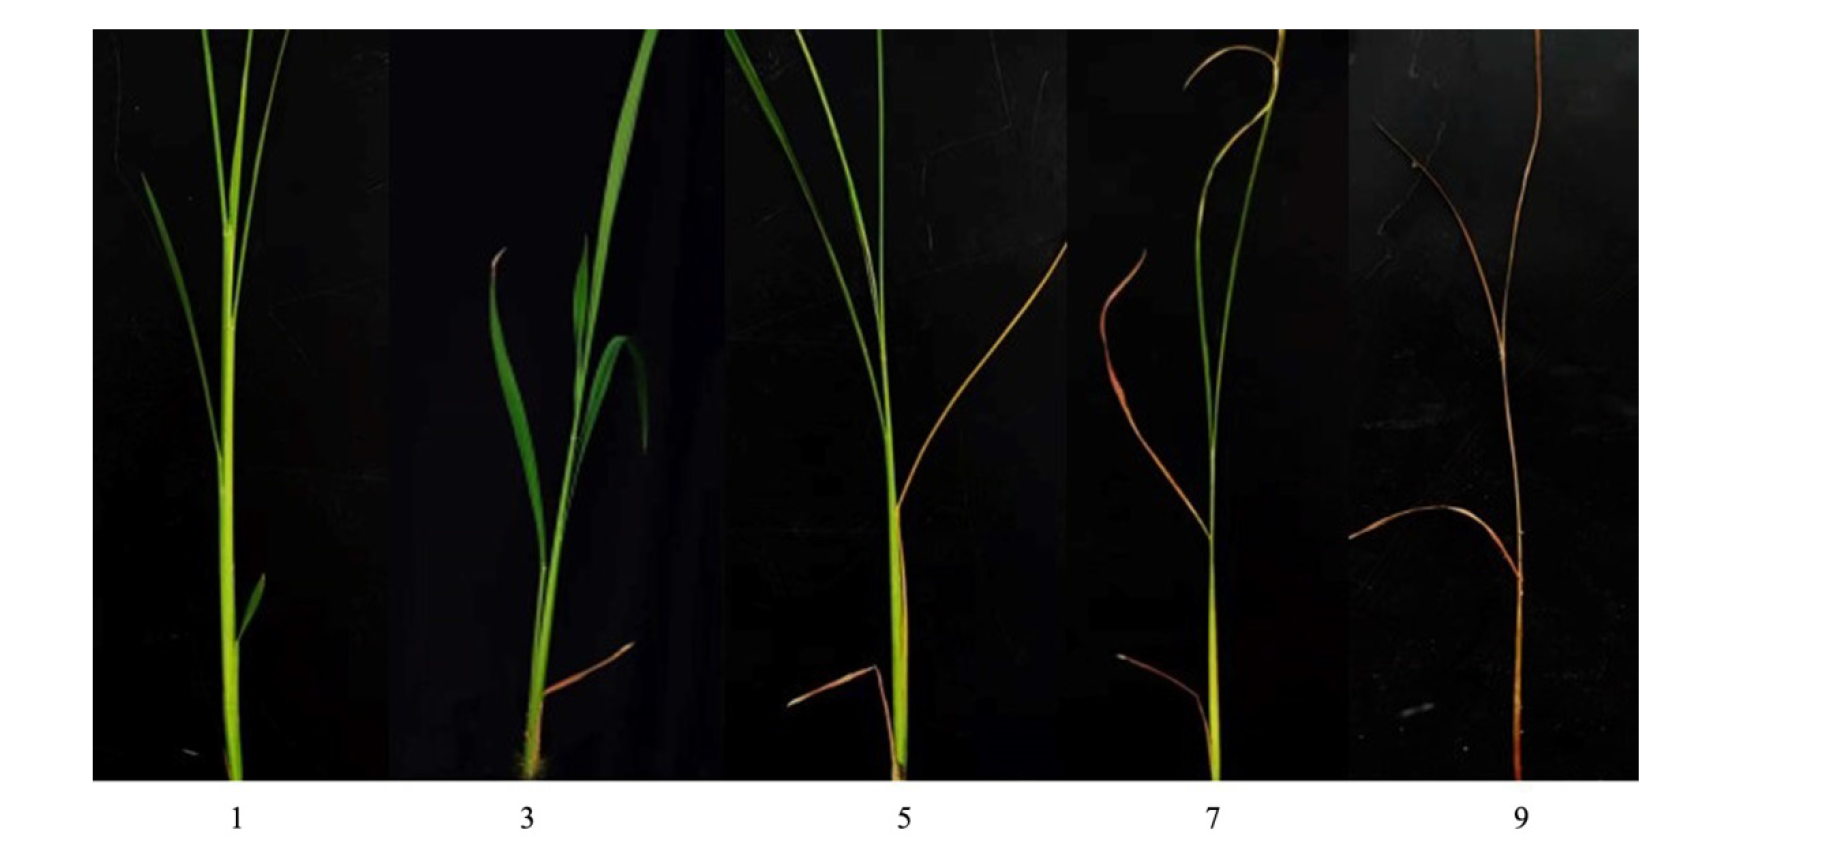
图1 水稻不同抗性级别分级
Fig. 1. Evaluation of different resistance levels in rice.
| 品种 Rice variety | 受害水平Damage rating | ||||
|---|---|---|---|---|---|
| 1级 Level 1 | 3级 Level 3 | 5级 Level 5 | 7级 Level 7 | 9级 Level 9 | |
| TN1 | 66 | 78 | 66 | 54 | 156 |
| Mudgo | 96 | 120 | 192 | 6 | 6 |
| RHT | 252 | 126 | 42 | 0 | 0 |
表2 光谱数据组成
Table 2. Composition of hyperspectral data.
| 品种 Rice variety | 受害水平Damage rating | ||||
|---|---|---|---|---|---|
| 1级 Level 1 | 3级 Level 3 | 5级 Level 5 | 7级 Level 7 | 9级 Level 9 | |
| TN1 | 66 | 78 | 66 | 54 | 156 |
| Mudgo | 96 | 120 | 192 | 6 | 6 |
| RHT | 252 | 126 | 42 | 0 | 0 |
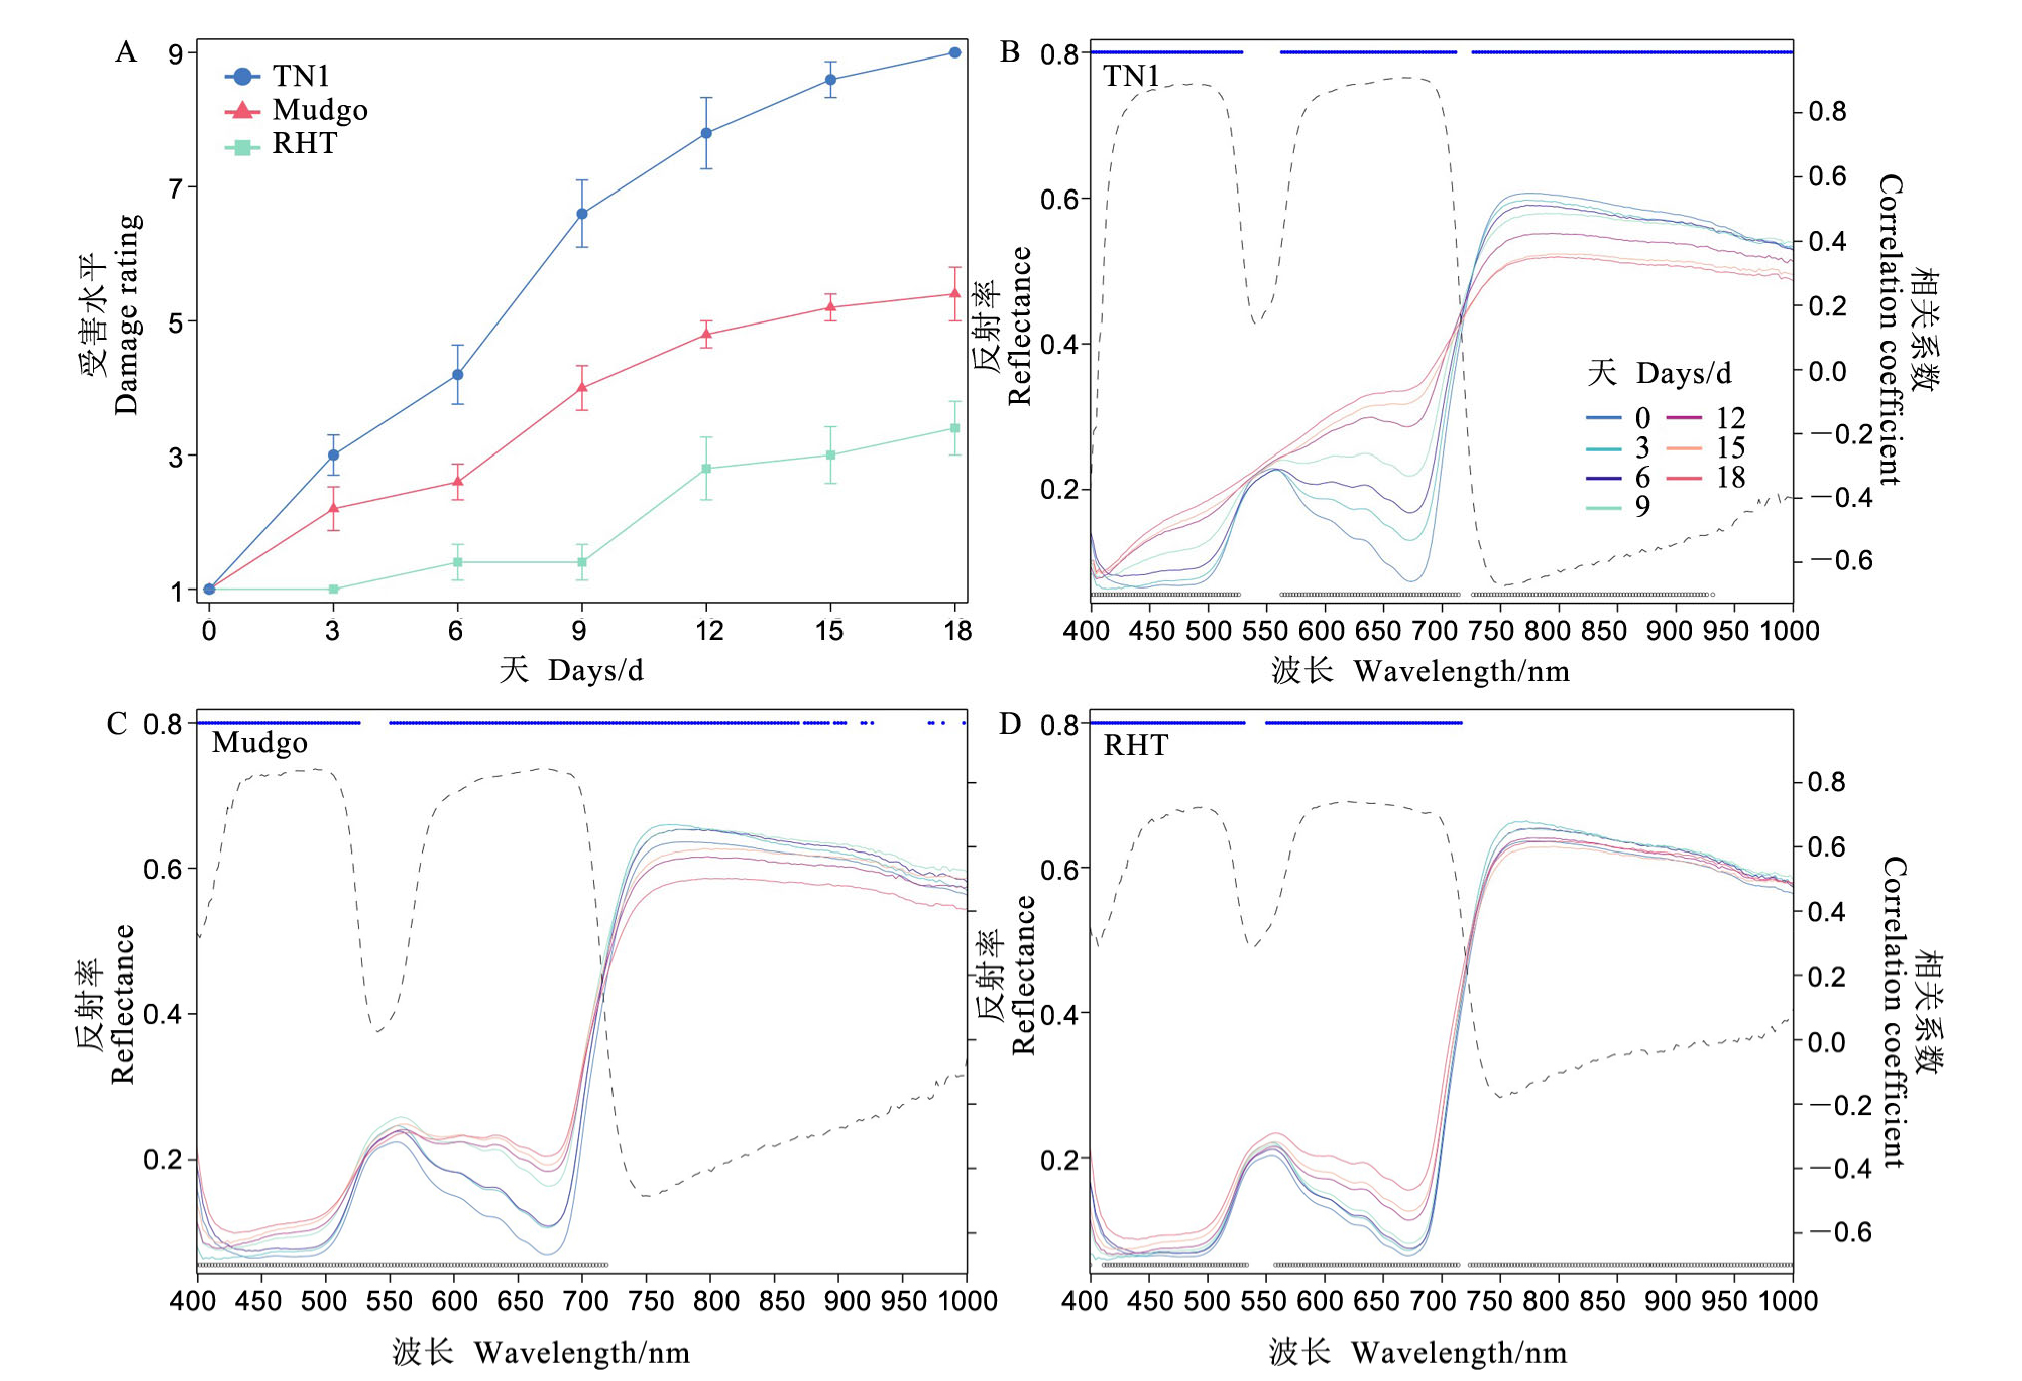
图2 褐飞虱胁迫不同时间3个水稻品种的受害水平(A)及高光谱反射率曲线(B-D) B~D图中虚线表示相关系数,上方蓝色表示具有显著差异的波段(P < 0.05),下方黑色表示显著相关的波段(P < 0.05),高光谱反射率曲线是所有重复的平均值。
Fig. 2. Damage rating (A) and hyperspectral reflectance curve (B-D) of the three rice varieties under the brown planthopper (Nilaparvata lugens) infestation for different days. The dashed lines in diagram B-D indicate correlation coefficients, with blue lines above indicating bands with significant differences (P < 0.05)and black lines below indicating bands with significant correlations(P < 0.05), hyperspectral reflectance curves are averaged over all replicates.
| 指数名称 Name of the index | 计算公式 Calculation formula | TN1 | Mudgo | RHT | 品种合并 Merge analysis |
|---|---|---|---|---|---|
| SIPI | (R800−R445)/(R800+R680) | −0.7978 | −0.5510 | −0.4826 | −0.7053 |
| SR605/760 | (R605/R760) | 0.7847 | 0.5539 | 0.4829 | 0.6885 |
| PSNDb | (R800−R635)/(R800+R635) | −0.7774 | −0.5494 | −0.4731 | −0.6924 |
| 680 nm(最敏感光波) 680 nm(Most sensitive light wave) | 0.7265 | 0.5217 | 0.4556 | 0.6456 |
表3 水稻品种的植被指数与褐飞虱胁迫天数之间的相关系数
Table 3. Correlation coefficient between the vegetation index of rice varieties and the days of brown planthopper infestation.
| 指数名称 Name of the index | 计算公式 Calculation formula | TN1 | Mudgo | RHT | 品种合并 Merge analysis |
|---|---|---|---|---|---|
| SIPI | (R800−R445)/(R800+R680) | −0.7978 | −0.5510 | −0.4826 | −0.7053 |
| SR605/760 | (R605/R760) | 0.7847 | 0.5539 | 0.4829 | 0.6885 |
| PSNDb | (R800−R635)/(R800+R635) | −0.7774 | −0.5494 | −0.4731 | −0.6924 |
| 680 nm(最敏感光波) 680 nm(Most sensitive light wave) | 0.7265 | 0.5217 | 0.4556 | 0.6456 |
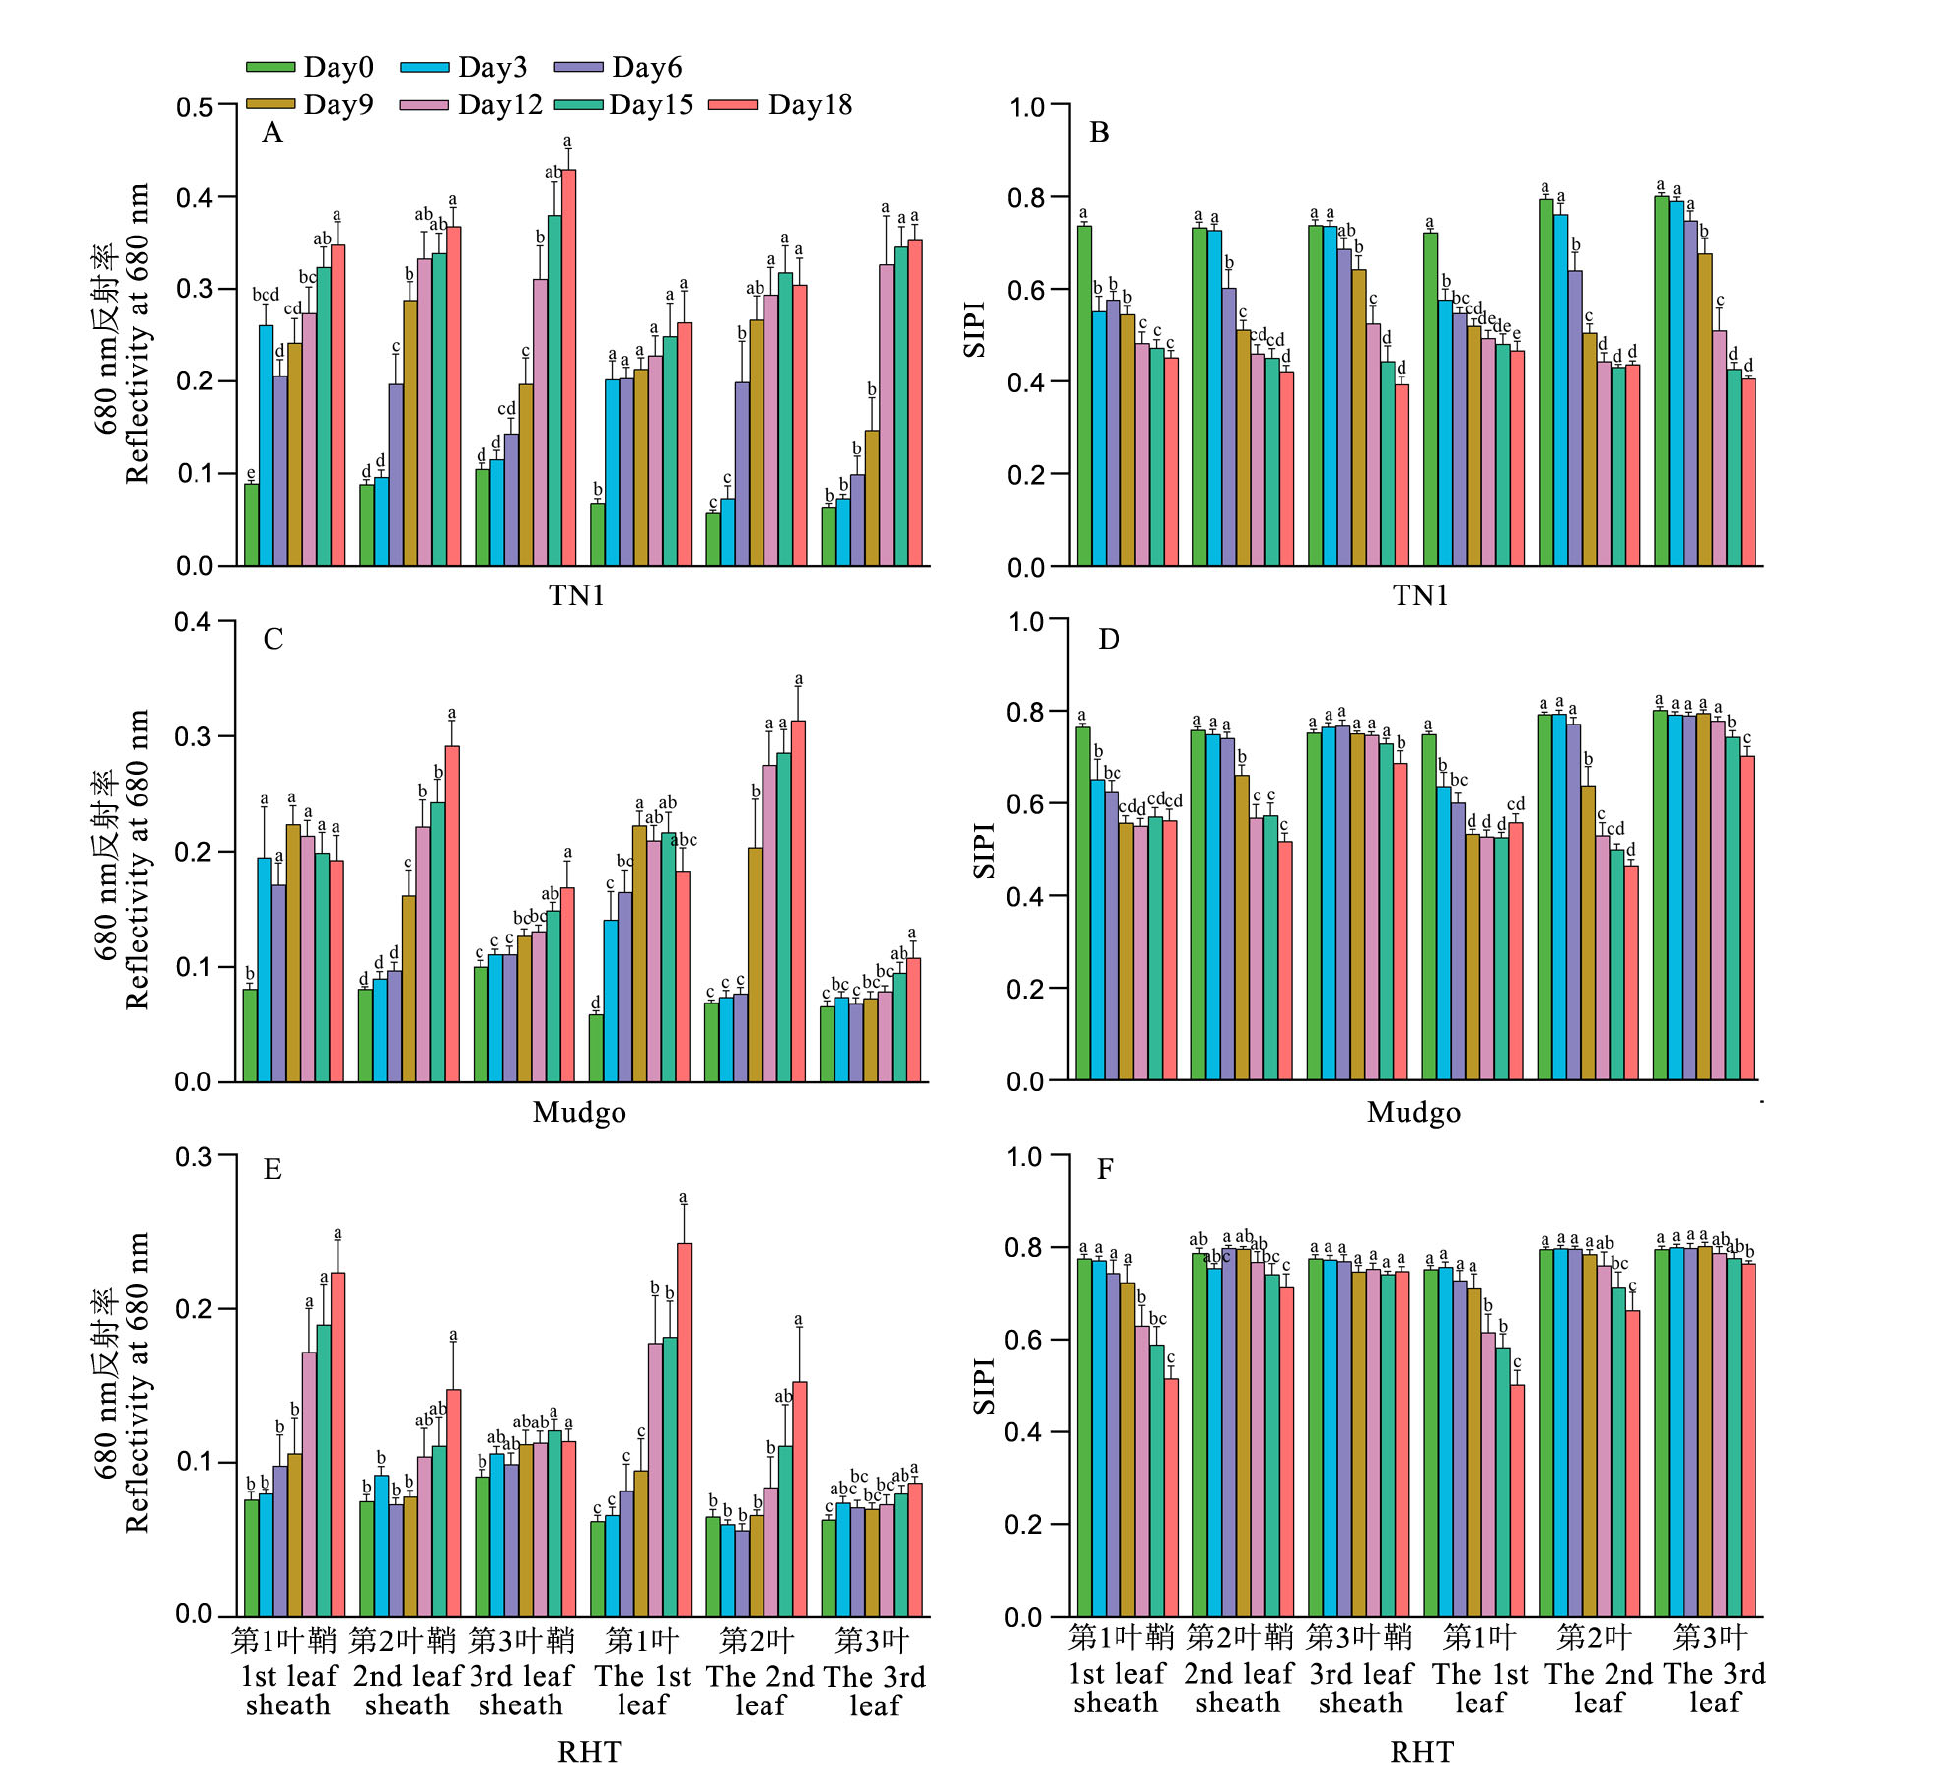
图3 褐飞虱胁迫下不同抗感水稻品种植株各部位680 nm平均反射率及植被指数SIPI的变化 不同字母表示胁迫天数间差异显著(P < 0.05)。
Fig. 3. Changes of mean reflectance and vegetation index SIPI of rice varieties with various resistance at 680 nm under the brown planthopper (Nilaparvata lugens) infestation. Different letters indicate significant difference among different days of BPH infestation(P < 0.05).
| 叶位 Leaf position in rice plant | 稻株部位 Rice plant part | TN1 | Mudgo | RHT |
|---|---|---|---|---|
| 第1叶The first leaf | 叶鞘Sheath | 2 | 3 | 11 |
| 叶片Leaf blade | 2 | 3 | 11 | |
| 第2叶The 2nd leaf | 叶鞘Sheath | 5 | 8 | 17 |
| 叶片Leaf blade | 5 | 8 | 17 | |
| 第3叶The 3rd leaf | 叶鞘Sheath | 11 | >18 | >18 |
| 叶片Leaf blade | 11 | >18 | >18 |
表4 水稻品种不同部位的植被指数SIPI出现显著变化的最短时间
Table 4. Shortest days when the vegetation index SIPI of different parts of rice varieties shows significant changes. d
| 叶位 Leaf position in rice plant | 稻株部位 Rice plant part | TN1 | Mudgo | RHT |
|---|---|---|---|---|
| 第1叶The first leaf | 叶鞘Sheath | 2 | 3 | 11 |
| 叶片Leaf blade | 2 | 3 | 11 | |
| 第2叶The 2nd leaf | 叶鞘Sheath | 5 | 8 | 17 |
| 叶片Leaf blade | 5 | 8 | 17 | |
| 第3叶The 3rd leaf | 叶鞘Sheath | 11 | >18 | >18 |
| 叶片Leaf blade | 11 | >18 | >18 |
| RF模型输入层 RF model input layer | 实测级别(级) Real level(grade) | 预测级别(级) Level of prediction (level) | |||||
|---|---|---|---|---|---|---|---|
| 1 | 3 | 5 | 7 | 9 | 准确率 Accuracy/% | ||
| 指数SIPI Index SIPI | 1 | 17 | 9 | 1 | 0 | 0 | 63.0 |
| 3 | 4 | 14 | 2 | 0 | 0 | 70.0 | |
| 5 | 0 | 3 | 18 | 0 | 0 | 85.7 | |
| 7 | 0 | 0 | 5 | 0 | 2 | 0.0 | |
| 9 | 0 | 0 | 2 | 0 | 8 | 80.0 | |
| 总计Total | 67.1 | ||||||
| 全波段光谱反射率 Full band spectral reflectance | 1 | 26 | 1 | 0 | 0 | 0 | 96.3 |
| 3 | 0 | 19 | 1 | 0 | 0 | 95.0 | |
| 5 | 0 | 2 | 19 | 0 | 0 | 90.1 | |
| 7 | 0 | 0 | 3 | 0 | 4 | 0.0 | |
| 9 | 0 | 0 | 1 | 0 | 9 | 90.0 | |
| 总计Total | 85.9 | ||||||
表5 基于指数SIPI和全光谱反射率的RF模型对测试集预测的混淆矩阵
Table 5. Confusion matrix of the test set that was predicted by random forest models with SIPI and full spectral reflectance.
| RF模型输入层 RF model input layer | 实测级别(级) Real level(grade) | 预测级别(级) Level of prediction (level) | |||||
|---|---|---|---|---|---|---|---|
| 1 | 3 | 5 | 7 | 9 | 准确率 Accuracy/% | ||
| 指数SIPI Index SIPI | 1 | 17 | 9 | 1 | 0 | 0 | 63.0 |
| 3 | 4 | 14 | 2 | 0 | 0 | 70.0 | |
| 5 | 0 | 3 | 18 | 0 | 0 | 85.7 | |
| 7 | 0 | 0 | 5 | 0 | 2 | 0.0 | |
| 9 | 0 | 0 | 2 | 0 | 8 | 80.0 | |
| 总计Total | 67.1 | ||||||
| 全波段光谱反射率 Full band spectral reflectance | 1 | 26 | 1 | 0 | 0 | 0 | 96.3 |
| 3 | 0 | 19 | 1 | 0 | 0 | 95.0 | |
| 5 | 0 | 2 | 19 | 0 | 0 | 90.1 | |
| 7 | 0 | 0 | 3 | 0 | 4 | 0.0 | |
| 9 | 0 | 0 | 1 | 0 | 9 | 90.0 | |
| 总计Total | 85.9 | ||||||
| [1] | 胡国文, 唐启义, 马巨法, 唐健, 朱敏. 中国褐飞虱的分布和为害[J]. 昆虫知识, 1997(1): 50-51+61. |
| Hu G W, Tang Q Y, Ma J F, Tang J, Zhu M. Distribution and damage of brown planthopper in China[J]. Chinese Bulletin of Entomology, 1997, 34(1): 50-51+61. (in Chinese) | |
| [2] | Denno R F, Roderick G K. Population biology of planthoppers[J]. Annual Review of Entomology, 1990. 35(1): 489-520. |
| [3] | Horgan F G, Jauregui A, Peñalver C A, Crisol M E, Bernal C C. Changes in reflectance of rice seedlings during planthopper feeding as detected by digital camera: Potential applications for high-throughput phenotyping[J]. PLoS One, 2020. 15(8): e0238173. |
| [4] | Liu Z Y, Wu H F, Huang J F. Application of neural networks to discriminate fungal infection levels in rice panicles using hyperspectral reflectance and principal components analysis[J]. Computers and Electronics in Agriculture, 2010. 72(2): 99-106. |
| [5] | 孙红, 李民赞, 周志艳, 刘刚, 罗锡文. 基于光谱技术的水稻稻纵卷叶螟受害区域检测[J]. 光谱学与光谱分析, 2010, 30(4): 1080-1083. |
| Sun H, Li M Z, Zhou Z Y, Liu G, Luo X W. Monitoring of cnaphalocrocis medinalis guenee based on canopy reflectance[J]. Spectroscopy and Spectral Analysis, 2010, 30(4): 1080-1083. (in Chinese with English abstract) | |
| [6] | 石晶晶, 刘占宇, 张莉丽, 周湾, 黄敬峰. 基于支持向量机(SVM)的稻纵卷叶螟危害水稻高光谱遥感识别[J]. 中国水稻科学, 2009, 23(3): 331-334. |
| Shi J J, Liu Z Y, Zhang L L, Zhou W, Huang J F. Hyperspectral recognition of rice damaged by rice leaf roller based on support vector machine[J]. Chinese Journal of Rice Science, 2009, 23(3): 331-334. (in Chinese with English abstract) | |
| [7] | Huang J, Liao H, Zhu Y, Sun J., Sun Q, Liu X. Hyperspectral detection of rice damaged by rice leaf folder (Cnaphalocrocis medinalis)[J]. Computers and Electronics in Agriculture, 2012, 82: 100-107. |
| [8] | 黄建荣, 孙启花, 刘向东. 稻纵卷叶螟危害后水稻叶片的光谱特征[J]. 中国农业科学, 2010, 43(13): 2679-2687. |
| Huang J R, Sun Q H, Liu X D. Spectral characteristics of rice leaves damaged by rice leaf roller[J]. Scientia Agricultura Sinica, 2010, 43(13): 2679-2687. (in Chinese with English abstract) | |
| [9] | Liu T, Shi T, Zhang H, Wu C. Detection of rise damage by leaf folder (Cnaphalocrocis medinalis) using unmanned aerial vehicle based hyperspectraldata[J]. Sustainability, 2020, 12(22): 9343. |
| [10] | Kobayashi T, Kanda E, Kitada K, Ishiguro K, Torigoe Y. Detection of rice panicle blast with multispectral radiometer and the potential of using airborne multispectral scanners[J]. Phytopathology, 2001. 91(3). |
| [11] | Tian L, Xue B, Wang Z, Li D, Yao X, Cao Q, Zhu Y, Cao W, Cheng T. Spectroscopic detection of rice leaf blast infection from asymptomatic to mild stages with integrated machine learning and feature selection[J]. Remote Sensing of Environment, 2021, 257: 112350. |
| [12] | 郑志雄, 齐龙, 马旭, 朱小源, 汪文娟. 基于高光谱成像技术的水稻叶瘟病病害程度分级方法[J]. 农业工程学报, 2013. 29(19): 138-144. |
| Zheng Z X, Qi L, Ma X, Zhu X Y, Wang W J. Grading method of rice leaf blast using hyperspectral imaging technology[J]. Transactions of the Chinese Society of Agricultural Engineering, 2013, 29(19): 138-144. (in Chinese with English abstract) | |
| [13] | Alisaac E, Behmann J, Kuska M T, Dehne H W, Mahlein A K. Hyperspectral quantification of wheat resistance to Fusarium head blight: Comparison of two Fusarium species[J]. European Journal of Plant Pathology, 2018. 152(4): 869-884. |
| [14] | Zhang J, Yang Y, Feng X, Xu H, Chen J, He Y. Identification of bacterial blight resistant rice seeds using terahertz imaging and hyperspectral imaging combined with convolutional neural network[J]. Frontiers in Plant Science, 2020, 11(821). |
| [15] | 薛来震, 徐磊, 谭晔, 刘向东. 不同品种水稻受褐飞虱危害后的光谱特征[J]. 南京农业大学学报, 2015. 38(5): 796-803. |
| Xue L Z, Xu L, Tan Y, Liu X D. Spectral characteristics of different rice cultivars damaged by the brown planthopper Nilaparvata lugens[J]. Journal of Nanjing Agricultural University, 2015. 38(5): 796-803. (in Chinese with English abstract) | |
| [16] | 孙启花. 褐飞虱和稻纵卷叶螟为害后水稻的光谱特征[D]. 南京: 南京农业大学, 2010. |
| Sun Q H. Spectral characteristics of rice damaged by Nilaparvata lugens(Stål) and Cnaphalocrocis medinalis(Guenée)[D], Nanjing: Nanjing Agricultural University, 2010. (in Chinese with English abstract) | |
| [17] | Yang C M, Cheng C H, Chen R K. Changes in spectral characteristics of rice canopy infested with brown planthopper and leaffolder[J]. Crop Science, 2007. 47(1): 329-335. |
| [18] | 孙启花, 刘向东. 褐飞虱危害在水稻植株光谱反射率上的表现[J]. 中国水稻科学, 2010, 24(2): 203-209. |
| Sun Q H, Liu X D. Spectral characteristics of the damaged rice plant by brown planthopper, Nilaparvata lugens[J]. Chinese Journal of Rice Science, 2010, 24(2): 203-209. (in Chinese with English abstract) | |
| [19] | Tucker C J. Red and photographic infrared linear combinations for monitoring vegetation[J]. Remote Sensing of Environment, 1979, 8(2): 127-150. |
| [20] | 黄敬峰, 王福民, 王秀珍, 刘飞. 水稻高光谱遥感实验与机理研究[M]. 杭州: 浙江大学出版社, 2010. |
| Huang J F, Wang F M, Wang X Z, Liu F. Experiment and Mechanism of Rice Hyperspectral Remote Sensing[M]. Hangzhou: Zhejiang Universisty Press, 2010. (in Chinese) | |
| [21] | Penuelas J B. Semi-empirical indices to assess carotenoids/chlorophyll a ratio from leaf spectral reflectance[J]. Photosynthetica, 1995, 31: 221-230. |
| [22] | Carter G A. Ratios of leaf reflectances in narrow wavebands as indicators of plant stress[J]. International Journal of Remote Sensing, 1994, 15(3): 697-703. |
| [23] | Blackburn G A. Spectral indices for estimating photosynthetic pigment concentrations: A test using senescent tree leaves[J]. International Journal of Remote Sensing, 1998: 657-675. |
| [24] | 魏勤, 陈仕军, 黄炜斌, 马光文, 陶春华. 利用随机森林回归的现货市场出清价格预测方法[J]. 中国电机工程学报, 2021, 41(4): 1360-1367. |
| Wei Q, Chen S J, Huang W B, Ma G W, Tao C H. Forecasting method of clearing price in spot market by random forest regression[J]. Proceedings of the CSEE, 2021, 41(4): 1360-1367. (in Chinese with English abstract) | |
| [25] | Joseph V R. Optimal ratio for data splitting[J]. Statistical Analysis and Data Mining, 2022, 15(4): 531-538. |
| [26] | 梁子超, 李智炜, 赖铿, 林卓琛, 李铁钢, 张晋昕. 10折交叉验证用于预测模型泛化能力评价及其R软件实现[J]. 中国医院统计, 2020, 27(4): 289-292. |
| Liang Z C, Li Z W, Lai K, Lin Z C, Li T G, Zhang J X. Application of 10-fold cross-validation in the evaluation of generalization ability of prediction models and the realization in R[J]. Chinese Journal of Hospital Statistics, 2020, 27(4): 289-292. | |
| [27] | Speiser J L, Miller M E, Tooze J, Edward I. A Comparison of random forest variable selection methods for classification prediction modeling[J]. Expert Systems with Applications, 2019, 134: 93-101. |
| [28] | Elliott N, Mirik M, Yang Z, Jones D, Phoofolo M, Catana V, Giles K, Michels G J. Airborne remote sensing to detect greenbug stress to wheat[J]. Southwestern Entomologist, 2009, 34(3): 205-211. |
| [29] | 邱白晶, 陈国平, 程麒文. 水稻白背飞虱虫害的冠层光谱特性与虫量反演[J]. 农业机械学报, 2008(9): 92-95+99. |
| Qiu B J, Chen G P, Cheng Q W. Canopy spectral reflectance feature of rice infected with Sogatella furcifera and insect number inversion[J]. Transactions of the Chinese Society for Agricultural Machinery, 2008(9): 92-95+99. (in Chinese with English abstract) | |
| [30] | 陈鹏程, 张建华, 李眉眉, 雷勇辉. 土耳其斯坦叶螨为害棉叶的生理变化及光谱特征分析[J]. 昆虫知识, 2007, 44(1): 61-65. |
| Chen P C, Zhang J F, Li M M, Lei Y H. Physiological change and hyperspectral character analysis of cotton leaves infested by Tetranychus turkestani[J]. Chinese Journal of Applied Entomology, 2007, 44(1): 61-65. (in Chinese with English abstract) | |
| [31] | Riedell W E, Blackmer T M. Leaf reflectance spectra of cereal aphid-damaged wheat[J]. Crop Science, 1999, 39: 1835-1840. |
| [32] | 吴达科, 马承伟, 杜尚丰. 支持向量机在斑潜蝇虫害叶片光谱分析中的应用[J]. 农业机械学报, 2007(10): 87. |
| Wu D K, Ma C W, Du S W. Classification visible spectra of leafminer-infected leaves by support vector machine[J]. Transactions of the Chinese Society for Agricultural Machinery, 2007, 38(10): 87. (in Chinese with English abstract) | |
| [33] | Lu Y, Li X, Li W, Shen T, He Z, Zhang M, Zhang H, Sun Y, Liu F. Detection of chlorpyrifos and carbendazim residues in the cabbage using visible/near-infrared spectroscopy combined with chemometrics[J]. Spectrochim Acta A: Molecular and Biomolecular Spectroscupy, 2021, 257: 119759. |
| [34] | Huang H, Shi G, He H, Duan Y, Luo F. Dimensionality reduction of hyperspectral imagery based on spatial-spectral manifold learning[J]. IEEE Transactions on Cybernetics, 2020. 50(6): 2604-2616. |
| [35] | 张敏, 郭涛, 刘轲, 黄平, 喻君, 刘仕川, 刘泳伶, 李源洪. 基于高光谱植被指数的水稻LAI遥感估算[J]. 西南农业学报, 2022, 35(11): 1-10. |
| Zhang M, Guo T, Liu K, Huang P, Yu J, Liu S C, Liu Y L, Li Y G. Estimating rice LAI in using remotely sensed hyperspectral vegetation index[J]. Southwest China Journal of Agricultural Sciences, 2022, 35(11): 2651-2658. (in Chinese with English abstract) | |
| [36] | 李娜. 基于多源遥感数据的玉米典型虫害监测研究[D]. 哈尔滨: 东北农业大学, 2012. |
| Li N. Research on corn bober monitoring base on multi-source remote sensing data[D]. Harbin: Northeast agricultural university, 2012. (in Chinese with English abstract) | |
| [37] | Qiu Z, Chen J, Zhao Y, Zhu S, He Y, Zhang C. Variety identification of single rice seed using hyperspectral imaging combined with convolutional neural network[J]. Applied Sciences, 2018, 8(2): 212. |
| [38] | 徐元统. 基于高光谱的水稻品种鉴别系统设计与实现[D]. 哈尔滨: 黑龙江大学, 2019. |
| Xu Y T. Design and implementation of rice variety identification system based on hyperspectral[D]. Harbin: Heilongjiang University, 2019. (in Chinese with English abstract) | |
| [39] | Hao Y, Geng P, Wu W, Wen Q, Rao M. Identification of rice varieties and transgenic characteristics based on near-infrared diffuse reflectance spectroscopy and chemometrics[J]. Molecules, 2019, 24(24): 4568. |
| [40] | Zhang J, Feng X, Wu Q, Yang G, Tao M, Yang Y, He Y. Rice bacterial blight resistant cultivar selection based on visible/near-infrared spectrum and deep learning[J]. Plant Methods, 2022, 18(1): 49. |
| [41] | Cao Y, Yuan P, Xu H, Martinez-Ortega J F, Feng J, Zhai Z. Detecting asymptomatic infections of rice bacterial leaf blight using hyperspectral imaging and 3-dimensional convolutional neural network with spectral dilated convolution[J]. Frontiers in Plant Science, 2022, 13: 963170. |
| [1] | 程玲, 黄福钢, 邱一埔, 王心怡, 舒宛, 邱永福, 李发活. 籼稻材料570011抗褐飞虱基因的遗传分析及鉴定[J]. 中国水稻科学, 2023, 37(3): 244-252. |
| [2] | 罗举, 杨素文, 贝文勇, 余军伟, 唐健, 刘淑华. 直接多重TaqMan qPCR方法快速鉴定褐飞虱属3种飞虱[J]. 中国水稻科学, 2023, 37(3): 329-336. |
| [3] | 何佳春, 何雨婷, 万品俊, 魏琪, 赖凤香, 陈祥盛, 傅强. 温度对褐飞虱天敌黄腿双距螯蜂生物学特性的影响[J]. 中国水稻科学, 2022, 36(3): 318-326. |
| [4] | 罗举, 唐健, 王爱英, 杨保军, 刘淑华. 基于重组酶介导扩增-侧流层析试纸条的褐飞虱快速鉴定方法[J]. 中国水稻科学, 2022, 36(1): 96-104. |
| [5] | 马银花, 李萍芳, 董文静, 易松望, 杨芳, 杜波, 金晨钟. 水稻抗性蛋白OsRRK1抗褐飞虱机理分析[J]. 中国水稻科学, 2020, 34(6): 512-519. |
| [6] | 潘磊, 王利华, 朱凤, 韩阳春, 王培, 方继朝. 褐飞虱小分子量热激蛋白基因表达特性和功能[J]. 中国水稻科学, 2020, 34(1): 37-45. |
| [7] | 朱永生, 白建林, 谢鸿光, 吴方喜, 罗曦, 姜身飞, 何炜, 陈丽萍, 蔡秋华, 谢华安, 张建福. 聚合白背飞虱和褐飞虱抗性基因创制杂交水稻恢复系[J]. 中国水稻科学, 2019, 33(5): 421-428. |
| [8] | 何佳春, 李波, 谢茂成, 赖凤香, 胡国文, 傅强. 新烟碱类及其他稻田杀虫剂对褐飞虱的室内药效评价[J]. 中国水稻科学, 2019, 33(5): 467-478. |
| [9] | 降好宇, 曾盖, 郝明, 黄湘桂, 肖应辉. 广谱抗稻瘟病种质75-1-127的褐飞虱抗性基因鉴定及分子标记辅助选择育种[J]. 中国水稻科学, 2019, 33(3): 227-234. |
| [10] | 张珏锋, 李芳, 钟海英, 陈建明. 制霉菌素对褐飞虱若虫解毒酶、尿酸酶含量的影响[J]. 中国水稻科学, 2019, 33(2): 186-190. |
| [11] | 朱欢欢, 陈洋, 万品俊, 王渭霞, 赖凤香, 傅强. 共生菌Arsenophonus、水稻品种和温度对褐飞虱黄绿绿僵菌发病率的影响[J]. 中国水稻科学, 2017, 31(6): 643-651. |
| [12] | 单丹, 王利华, 张月亮, 韩阳春, 牛洪涛, 潘磊, 方继朝. 褐飞虱热激蛋白70在不同温度胁迫下的差异表达特性研究[J]. 中国水稻科学, 2017, 31(5): 533-541. |
| [13] | 赵晨星, 俞叶微, 许益鹏, 俞晓平. 褐飞虱两个dynamin-1-like基因的克隆、多克隆抗体制备及 表达定位[J]. 中国水稻科学, 2017, 31(4): 345-354. |
| [14] | 陈龙飞, 万品俊, 王渭霞, 傅强, 朱廷恒. 褐飞虱NlTgo基因的克隆及功能研究[J]. 中国水稻科学, 2016, 30(6): 653-660. |
| [15] | 郑瑜, 何佳春, 万品俊, 赖凤香, 孙燕群, 林晶晶, 傅强. 褐飞虱IR56种群的致害特征[J]. 中国水稻科学, 2016, 30(5): 552-558. |
| 阅读次数 | ||||||
|
全文 |
|
|||||
|
摘要 |
|
|||||