中国水稻科学 ›› 2015, Vol. 29 ›› Issue (4): 408-416.DOI: 10.3969/j.issn.1001G7216.2015.04.010
王磊1,2,*( ), 程本义1, 鄂志国1,2, 杨仕华1,*()
收稿日期:2014-09-19
修回日期:2014-11-19
出版日期:2015-07-10
发布日期:2015-07-10
通讯作者:
王磊,杨仕华
基金资助:
Lei WANG1,2,*(), Ben-yi CHENG1, Zhi-guo E1,2, Shi-hua YANG1,*()
Received:2014-09-19
Revised:2014-11-19
Online:2015-07-10
Published:2015-07-10
Contact:
Lei WANG, Shi-hua YANG
摘要:
区域试验是作物新品种从选育到审定、推广的重要环节。而对试验数据的分析汇总,尤其是参试品种的丰产性、稳产性和适应性分析,比较流行和有效的方法是AMMI模型和SREG模型的GGE双标图,但基于SREG模型的GGE双标图的方法应用在近年来更为广泛。本文简要介绍GGE双标图,并以2012年南方稻区晚籼早熟B组品种区域试验数据为例,利用GGE双标图对参试品种进行丰产性、稳产性和适应性评价,并对评价中的注意事项作了讨论。
中图分类号:
王磊, 程本义, 鄂志国, 杨仕华. 基于GGE双标图的水稻区试品种丰产性、稳产性和适应性评价[J]. 中国水稻科学, 2015, 29(4): 408-416.
Lei WANG, Ben-yi CHENG, Zhi-guo E, Shi-hua YANG. Use of GGE Biplots in the Yielding Ability, Stability and Adaptation Evaluation for the Varieties in the Rice Regional Trials[J]. Chinese Journal OF Rice Science, 2015, 29(4): 408-416.
| 编号 No. | 组合名称 Combination | 亲本组合 Parental combination | 产量 Yield /(t·hm-2) | 排序 Ranking |
|---|---|---|---|---|
| 1 | 两优5266 Liangyou 5266 | W05-2×R066 | 8.811 | 1 |
| 2 | 两优988 Liangyou 988 | 富1S×R988 Fu 1S×R988 | 8.669 | 3 |
| 3 | 全优1093 Quanyou 1093 | 全丰A×福恢1093 Quanfeng A×Fuhui 1093 | 7.579 | 12 |
| 4 | 安丰优3698 Anfengyou 3698 | 安丰A×广恢3698 Anfeng A×Guanghui 3698 | 8.545 | 4 |
| 5 | 五优321 Wuyou 321 | 五丰A×广恢321 Wufeng A×Guanghui 321 | 8.085 | 8 |
| 6 | 两优33 Liangyou 33 | HD9802S×R33 | 8.288 | 6 |
| 7 | 扬两优353 Yangliangyou 353 | 扬籼3S×扬恢153 Yangxian 3S×Yanghui 153 | 7.966 | 10 |
| 8 | 启优40 Qiyou 40 | 启A×ZR40 Qi A×ZR40 | 7.799 | 11 |
| 9 | 深优9566 Shenyou 9566 | 深95A×R366 Shen 95A×R366 | 8.733 | 2 |
| 10 | 两优937 Liangyou 937 | 03S×R937 | 8.066 | 9 |
| 11 | 广两优7203 Guangliangyou 7203 | 广占63S×中恢7203 Guangzhan 63S×Zhonghui 7203 | 8.532 | 5 |
| 12 | 五优308(对照) Wuyou 308(CK) | 五丰A×广恢308 Wufeng A×Guanghui 308 | 8.279 | 7 |
表 1 2012年南方稻区晚籼早熟B组区试品种基本情况
Table 1 Basic information in 2012 testing group B of early maturity indica rice variety for late season in Southern China Rice Regional Trials.
| 编号 No. | 组合名称 Combination | 亲本组合 Parental combination | 产量 Yield /(t·hm-2) | 排序 Ranking |
|---|---|---|---|---|
| 1 | 两优5266 Liangyou 5266 | W05-2×R066 | 8.811 | 1 |
| 2 | 两优988 Liangyou 988 | 富1S×R988 Fu 1S×R988 | 8.669 | 3 |
| 3 | 全优1093 Quanyou 1093 | 全丰A×福恢1093 Quanfeng A×Fuhui 1093 | 7.579 | 12 |
| 4 | 安丰优3698 Anfengyou 3698 | 安丰A×广恢3698 Anfeng A×Guanghui 3698 | 8.545 | 4 |
| 5 | 五优321 Wuyou 321 | 五丰A×广恢321 Wufeng A×Guanghui 321 | 8.085 | 8 |
| 6 | 两优33 Liangyou 33 | HD9802S×R33 | 8.288 | 6 |
| 7 | 扬两优353 Yangliangyou 353 | 扬籼3S×扬恢153 Yangxian 3S×Yanghui 153 | 7.966 | 10 |
| 8 | 启优40 Qiyou 40 | 启A×ZR40 Qi A×ZR40 | 7.799 | 11 |
| 9 | 深优9566 Shenyou 9566 | 深95A×R366 Shen 95A×R366 | 8.733 | 2 |
| 10 | 两优937 Liangyou 937 | 03S×R937 | 8.066 | 9 |
| 11 | 广两优7203 Guangliangyou 7203 | 广占63S×中恢7203 Guangzhan 63S×Zhonghui 7203 | 8.532 | 5 |
| 12 | 五优308(对照) Wuyou 308(CK) | 五丰A×广恢308 Wufeng A×Guanghui 308 | 8.279 | 7 |
| 区试点代码 Location code | 区试点 Testing location | 经度 Longitude | 纬度 Latitude | 产量均值 Yield mean /(t·hm-2) | 排序 Ranking | 均方误 Error mean square | 变异系数 Coefficient of variation | 变异幅度 Variation range |
|---|---|---|---|---|---|---|---|---|
| A | 安徽芜湖 Wuhu, Anhui Province | 117°57' | 30°38' | 7.706 | 11 | 0.075 | 3.55 | 1.637 |
| B | 湖北京山 Jingshan, Hubei Province | 113°07' | 31°01' | 8.977 | 4 | 0.083 | 3.21 | 2.090 |
| C | 湖北荆州 Jingzhou, Hubei Province | 112°02' | 30°24' | 9.754 | 1 | 0.086 | 3.01 | 1.733 |
| D | 湖北孝感 Xiaogan, Hubei Province | 113°19' | 30°22' | 7.106 | 13 | 0.155 | 5.54 | 2.103 |
| E | 湖南长沙 Changsha, Hunan Province | 113°05' | 28°12' | 7.741 | 10 | 0.012 | 1.42 | 1.837 |
| F | 湖南常德 Changde, Hunan Province | 111°58' | 28°03' | 8.487 | 7 | 0.117 | 4.04 | 1.603 |
| G | 湖南岳阳 Yueyang, Hunan Province | 113°05' | 29°24' | 9.003 | 3 | 0.045 | 2.37 | 0.923 |
| H | 江西赣州 Ganzhou, Jiangxi Province | 114°57' | 25°51' | 7.045 | 14 | 0.025 | 2.26 | 1.077 |
| I | 江西九江 Jiujiang, Jiangxi Province | 115°48' | 29°26' | 8.639 | 5 | 0.068 | 3.01 | 1.960 |
| J | 江西南昌 Nanchang, Jiangxi Province | 115°58' | 28°41' | 8.31 | 8 | 0.018 | 1.60 | 1.523 |
| K | 江西宜春Yichun, Jiangxi Province | 114°23' | 27°48' | 7.109 | 12 | 0.009 | 1.36 | 1.513 |
| L | 江西余江Yujiang, Jiangxi Province | 116°51' | 28°12' | 8.621 | 6 | 0.020 | 1.65 | 1.900 |
| M | 浙江富阳 Fuyang, Zhejiang Province | 120°19' | 30°12' | 8.124 | 9 | 0.029 | 2.11 | 2.627 |
| N | 浙江诸暨Zhuji, Zhejiang Province | 120°16' | 29°42' | 9.467 | 2 | 0.027 | 1.73 | 1.793 |
表2 2012年南方稻区晚籼早熟B组区试点基本信息
Table 2 Basic testing location information for 2012 trial group B of the early maturity indica rice for late season in Southern China Rice Regional Trials.
| 区试点代码 Location code | 区试点 Testing location | 经度 Longitude | 纬度 Latitude | 产量均值 Yield mean /(t·hm-2) | 排序 Ranking | 均方误 Error mean square | 变异系数 Coefficient of variation | 变异幅度 Variation range |
|---|---|---|---|---|---|---|---|---|
| A | 安徽芜湖 Wuhu, Anhui Province | 117°57' | 30°38' | 7.706 | 11 | 0.075 | 3.55 | 1.637 |
| B | 湖北京山 Jingshan, Hubei Province | 113°07' | 31°01' | 8.977 | 4 | 0.083 | 3.21 | 2.090 |
| C | 湖北荆州 Jingzhou, Hubei Province | 112°02' | 30°24' | 9.754 | 1 | 0.086 | 3.01 | 1.733 |
| D | 湖北孝感 Xiaogan, Hubei Province | 113°19' | 30°22' | 7.106 | 13 | 0.155 | 5.54 | 2.103 |
| E | 湖南长沙 Changsha, Hunan Province | 113°05' | 28°12' | 7.741 | 10 | 0.012 | 1.42 | 1.837 |
| F | 湖南常德 Changde, Hunan Province | 111°58' | 28°03' | 8.487 | 7 | 0.117 | 4.04 | 1.603 |
| G | 湖南岳阳 Yueyang, Hunan Province | 113°05' | 29°24' | 9.003 | 3 | 0.045 | 2.37 | 0.923 |
| H | 江西赣州 Ganzhou, Jiangxi Province | 114°57' | 25°51' | 7.045 | 14 | 0.025 | 2.26 | 1.077 |
| I | 江西九江 Jiujiang, Jiangxi Province | 115°48' | 29°26' | 8.639 | 5 | 0.068 | 3.01 | 1.960 |
| J | 江西南昌 Nanchang, Jiangxi Province | 115°58' | 28°41' | 8.31 | 8 | 0.018 | 1.60 | 1.523 |
| K | 江西宜春Yichun, Jiangxi Province | 114°23' | 27°48' | 7.109 | 12 | 0.009 | 1.36 | 1.513 |
| L | 江西余江Yujiang, Jiangxi Province | 116°51' | 28°12' | 8.621 | 6 | 0.020 | 1.65 | 1.900 |
| M | 浙江富阳 Fuyang, Zhejiang Province | 120°19' | 30°12' | 8.124 | 9 | 0.029 | 2.11 | 2.627 |
| N | 浙江诸暨Zhuji, Zhejiang Province | 120°16' | 29°42' | 9.467 | 2 | 0.027 | 1.73 | 1.793 |
| 变异来源 Variation of source | 自由度 Degrees of freedom | 平方和 Sums of square | 均方 Mean of square | F值 F -value | P值 P-value | 占总变异比例 Proportion in the total SS |
|---|---|---|---|---|---|---|
| 组合 Combination(G) | 11 | 23.486 | 2.135 | 118.611 | 0.00001 | 0.148 |
| 地点 Site(E) | 13 | 111.572 | 8.583 | 476.833 | 0.00001 | 0.701 |
| 品种×地点(G×E) | 143 | 23.999 | 0.168 | 9.333 | 0.00001 | 0.151 |
| 合并误差 | 308 | 5.651 | 0.018 |
表3 2012年南方稻区晚籼早熟B组区试数据方差分析
Table 3 ANOVA for 2012 trial group B data of the early maturity indica rice for late season in Southern China Rice Regional Troulsi.
| 变异来源 Variation of source | 自由度 Degrees of freedom | 平方和 Sums of square | 均方 Mean of square | F值 F -value | P值 P-value | 占总变异比例 Proportion in the total SS |
|---|---|---|---|---|---|---|
| 组合 Combination(G) | 11 | 23.486 | 2.135 | 118.611 | 0.00001 | 0.148 |
| 地点 Site(E) | 13 | 111.572 | 8.583 | 476.833 | 0.00001 | 0.701 |
| 品种×地点(G×E) | 143 | 23.999 | 0.168 | 9.333 | 0.00001 | 0.151 |
| 合并误差 | 308 | 5.651 | 0.018 |
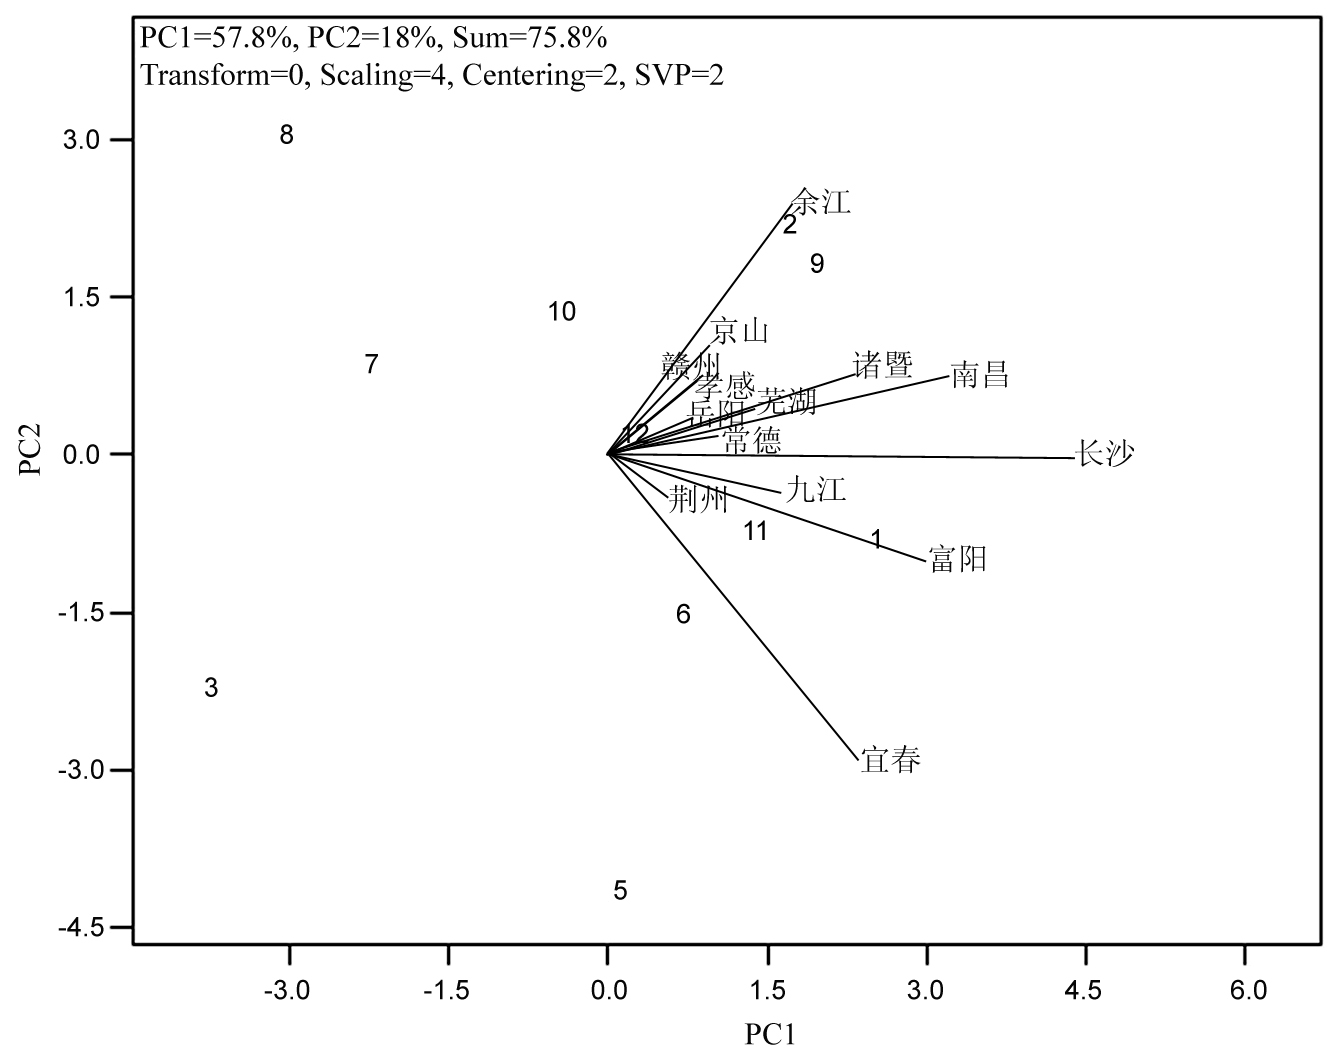
图1 用于比较参试品种在某个试验点表现的GGE双标图(横坐标轴代表第一主成分(PC1),解释了57.80%数据变异平方和(PC1=57.80%),纵坐标轴代表第二主成分(PC2),解释了18%的数据变异平方和(PC2=18.00%)。PC1和PC2总计解释了75.8%的数据平方和(Sum=75.8%)。对于GGE双标图分析的数据,没有做任何数据变换(Transform=0),但进行了均值标准误尺度变换(Scaling=4)。 Centering=2表明双标图是基于地点中心化后的双标图,也就是GGE双标图,而 SVP=2表示模型中的奇异值 λ1和 λ2重新分配到地点(模型5中的f=0)。)
Fig. 1. GGE biplot for the performance comparisons of testing varieties in one particular testing location.(The x-axis represents the first principal component (PC1), which explains 57.80% of total sum of squares of data variation (PC1=57.80%); while the y-axis represents the second principal component (PC2) which explains 18.00% of total sum of squares of data variation (PC2 =1.008%). The total variation explained by PC1 and PC2 is 75.8% (Sum=75.80%). Before the data to be used in the computation for the GGE biplots, no transformations were made (Transform=0), but scaled transformation based on the standard error of the mean for each site were made (Scaling=4). Centering=2 indicates the data were centered by removing the environment effect, resulting in the biplots to be of GGE biplots; and SVP=2 indicates the singular-value partitioning (SVP) is environment-focused scaling (f=0 in the model 5).)
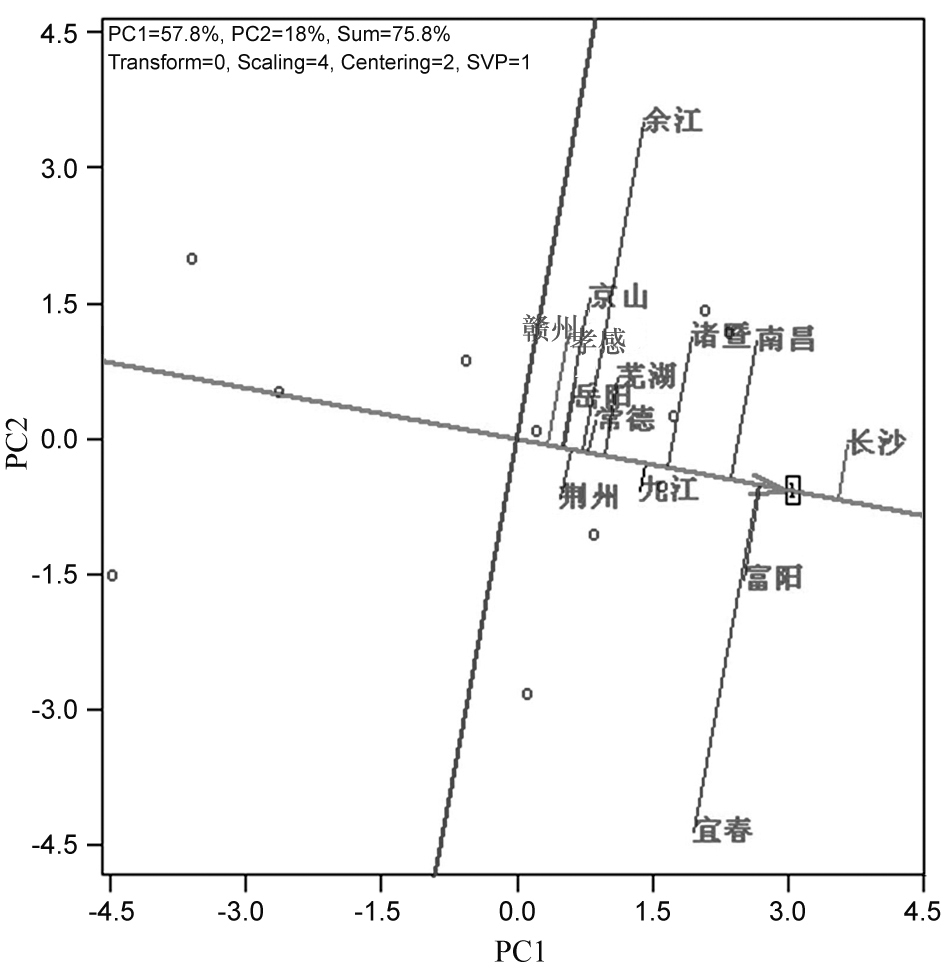
图2 用于比较参试品种在各试验点表现的GGE双标图(除了采用聚焦品种的特征值分配方法SVP=1,即模型5中的f=1,图形参数与图1相同。)
Fig. 2. GGE biplots for the performance comparisons of one particular testing variety in different testing locations(All the parameters in the plot are identical to Fig. 1 except SVP=1 indicating f=1 in the model 5, i.e., variety-focused partitioning was used in the modeling.).
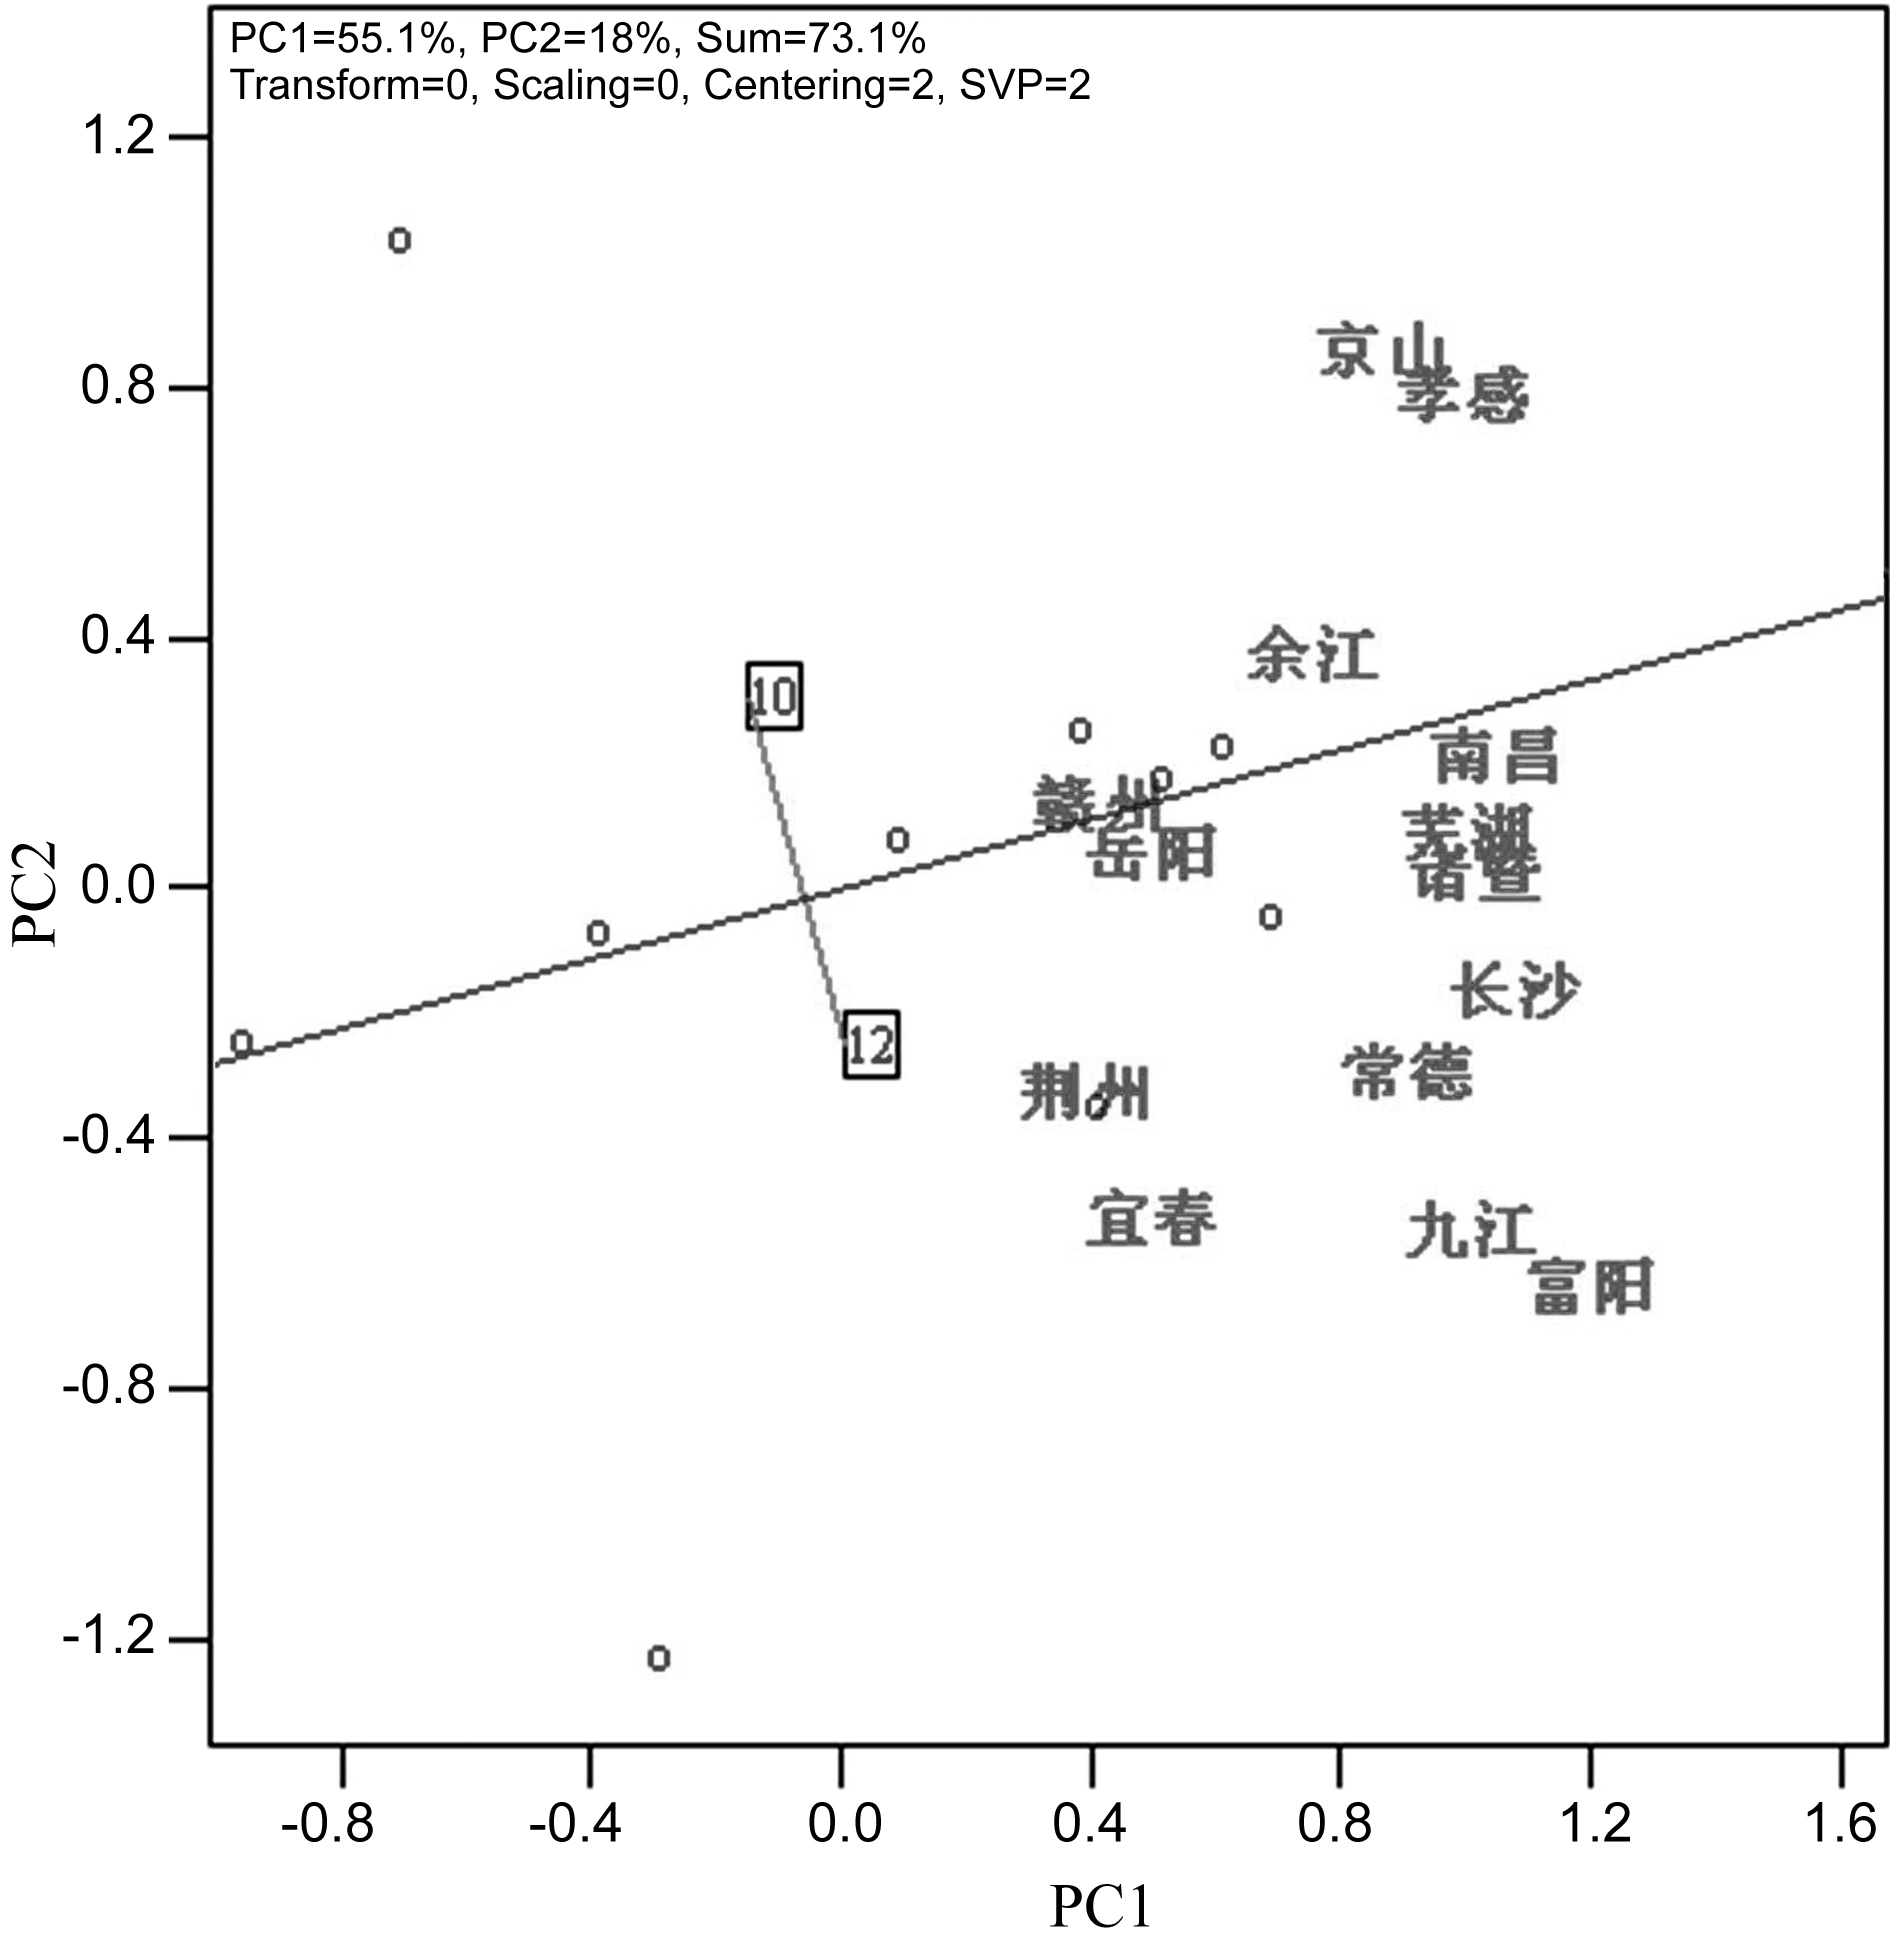
图3 用于比较两个参试品种在各试验点表现的GGE双标图(图形参数与图1相同, 品种代码10 为两优937,而品种12为对照品种五优308。为了清楚地显示这一比较的效果,图中隐藏了其余品种的代码。)
Fig. 3. GGE biplot for the performance comparisons of two testing varieties in different testing locations.(All the parameters in the plot are identical to Fig. 1. The varieties coded 10 and 12 are Liangyou 937 and check variety Wuyou 308. The codes for the other varieties are hidden in order to enhance the comparison of these two varieties.)
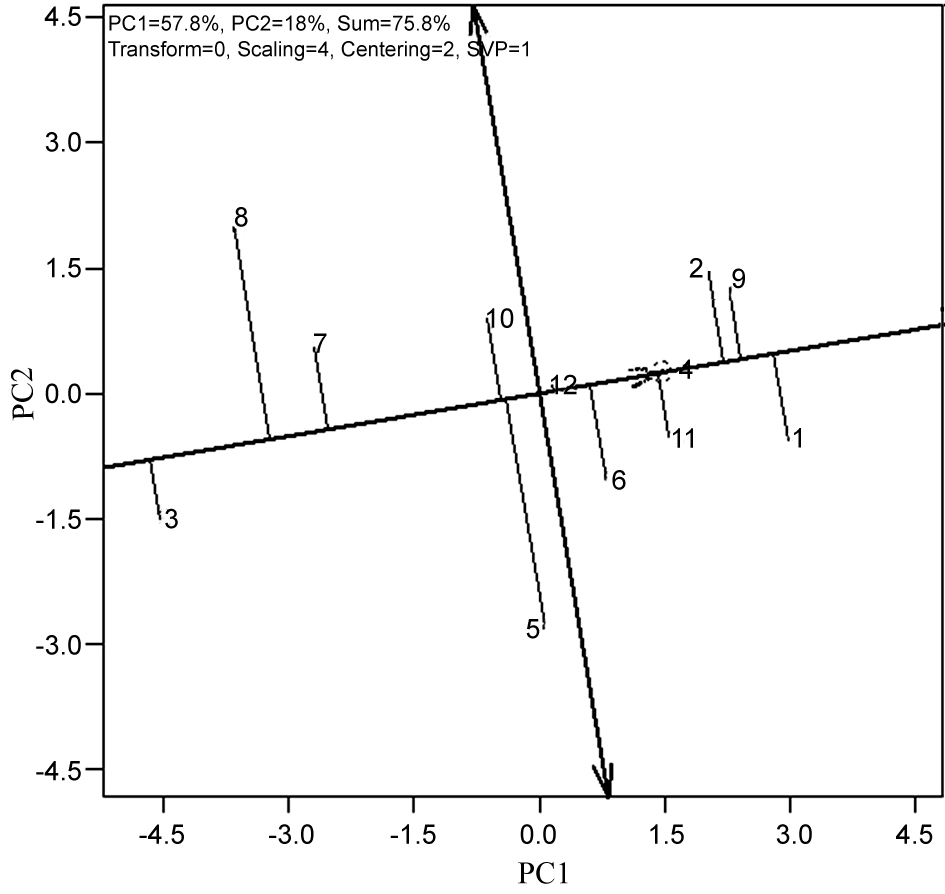
图4 “高产性与稳定性”功能形态的 GGE双标图(除了采用聚焦品种的特征值分配方法SVP=1,即模型5中的f = 1,图形参数与图1相同。同时为了清楚地显示品种的信息,隐藏了地点。)
Fig. 4. High yield and stability view of GGE biplot.(All the parameters in the plot are identical to that of Fig. 1 except SVP = 1 indicating f =1 in the model 5, i.e., variety-focused partitioning was used in the modeling. The test sites are hidden in order to enhance the varietal comparisons in the plot.)
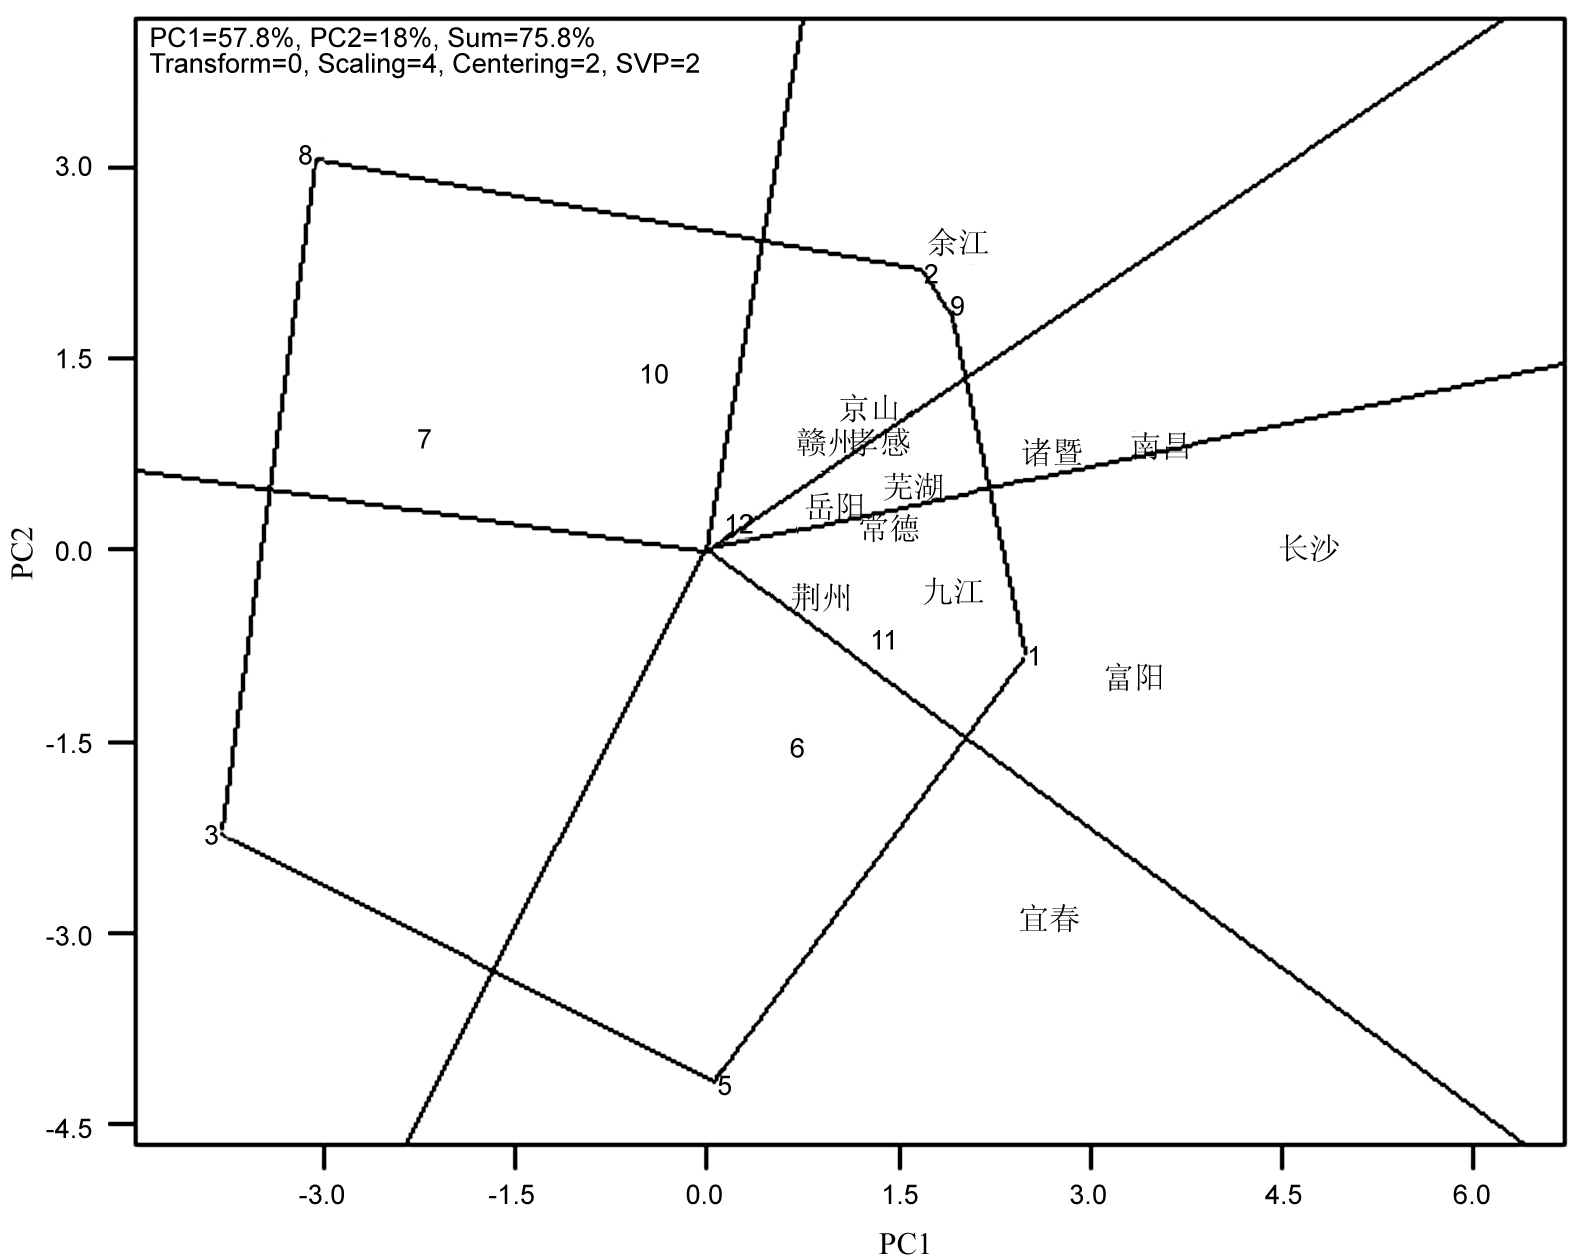
图5 “哪个赢在哪里”功能形态的GGE双标图(图形参数与图1相同,品种代码参见表1。)
Fig. 5. Which-won-where view of GGE biplot.(All the parameters in the plot are identical to Fig. 1 and the codes for the testing varieties in the plot are given in the Table 1.)
| [1] | 张群远, 孔繁玲, 廖琴, 等. 作物品种区域试验的评价体系及评价方法. 农业系统科学与综合研究, 2000, 16(2): 81-86. |
| [2] | 杨仕华, 廖琴. 中国水稻品种试验与审定. 北京: 中国农业科学出版社, 2005. |
| [3] | 杨仕华, 魏兴华. 水稻新品种评价体系//程式华, 李建. 现代中国水稻. 北京: 金盾出版社, 2007: 325-360. |
| [4] | Gauch H G.Model selection and validation for yield trials with interaction.Biometrics, 1988, 44: 705-715. |
| [5] | Gauch H G, Zobel R W.Predictive and postdictive success of statistical analyses of yield trials.Theor Appl Genet, 1988, 76: 1-10. |
| [6] | Gauch H G.1992. 产量区域试验统计分析-因子设计的AMMI分析. 王磊, 张群远, 张冬晓, 译, 2001. 北京: 中国农业科技出版社. |
| [7] | Cooper M, Hammer G L.Plant adaptation and crop improvement, Wilingford, UK. CAB International, 1996. |
| [8] | Gauch H G, Zobel R W.Identifying mega-environmnets and targeting genotypes.Crop Sci, 1997, 37: 311-326. |
| [9] | Kempton R A, Fox P N.Statistical methods for plant variety evaluation. London: Chapman&Hall, 1997 |
| [10] | 严威凯, 盛庆来, 胡跃高, 等. GGE叠图法分析品种环境互作模式的理想方法. 作物学报, 2001, 27(1): 21-28. |
| [11] | Yan W K, Tinker N A.Biplot analysis of multi-environment trial data: Principles and applications.Can J Plant Sci, 2006, 86: 623-645. |
| [12] | 严威凯. 双标图分析在农作物品种多点试验中的应用. 作物学报, 2010, 36(11): 1805-1819. |
| [13] | 常磊, 柴守玺. GGE双标图在我国旱地春小麦稳产性分析中的应用. 中国生态农业学报, 2010, 18(5): 988-994. |
| [14] | 罗俊, 张华, 邓祖湖, 等. 应用GGE双标图分析甘蔗品种(系)的产量和品质性状. 作物学报, 2013, 39(1): 142-152. |
| [15] | 张志芬, 付晓峰, 刘俊青, 等. 用GGE双标图分析燕麦区域试验品系产量稳定性及试点代表性. 作物学报, 2010, 36(8): 1377-1385. |
| [16] | 陈四龙, 李玉荣, 程增书, 等. 用GGE双标图分析种植密度对高油花生生长和产量的影响. 作物学报, 2009, 35(7): 1328-1335. |
| [17] | 尚毅, 李少钦, 李殿荣, 等. 用双标图分析油菜双列杂交试验. 作物学报, 2006, 32(2): 243-248. |
| [18] | 许乃银, 张国伟, 李健, 等. 基于GGE双标图和比强度选择的棉花品种生态区划分. 中国生态农业学报, 2012, 20(11): 1500-1507. |
| [19] | 许乃银, 张国伟, 李健, 等. 基于HA-GGE双标图的长江流域棉花区域试验环境评价. 作物学报, 2012, 38(12): 2229-2236. |
| [20] | 许乃银, 张国伟, 李健, 等. 基于GGE双标图的棉花品种生态区划分. 应用生态学报, 2013, 24(3): 771-776. |
| [21] | 许乃银, 张国伟, 李健, 等. 长江流域棉花纤维比强度选择的理想试验环境筛选. 棉花学报, 2013, 25(2): 121-128. |
| [22] | 全国农业技术推广服务中心, 中国水稻研究所. 中国水稻新品种试验: 2012年南方稻区国家水稻品种区试汇总报告. 北京: 中国农业科学技术出版社, 2013. |
| [23] | Kroonenberg P M.Introduction to biplots for GE tables. 1995. . |
| [24] | 王磊, McLaren C G, 杨仕华. 利用双标图分析基因型和环境交互作用. 科技通报, 1997, 13(5): 281-286 |
| [25] | 王磊, McLaren C G, 杨仕华. 利用双标图分析作物区试数据. 生物数学学报, 1997, 12(5): 587-563. |
| [26] | Gauch H G.Statistical analysis of yield trials by AMMI and GGE.Crop Sci, 2006, 46: 1488-1500. |
| [27] | Jolliffee I T.Principal component analysis. 2nd ed, Springer 2002. |
| [28] | Yan W K, Cornelius P L, Crossa J, et al.Two types of GGE biplots for analyzing multi-environment trial data.Crop Sci, 2001, 41: 656-663. |
| [1] | 郭展, 张运波. 水稻对干旱胁迫的生理生化响应及分子调控研究进展[J]. 中国水稻科学, 2024, 38(4): 335-349. |
| [2] | 韦还和, 马唯一, 左博源, 汪璐璐, 朱旺, 耿孝宇, 张翔, 孟天瑶, 陈英龙, 高平磊, 许轲, 霍中洋, 戴其根. 盐、干旱及其复合胁迫对水稻产量和品质形成影响的研究进展[J]. 中国水稻科学, 2024, 38(4): 350-363. |
| [3] | 许丹洁, 林巧霞, 李正康, 庄小倩, 凌宇, 赖美玲, 陈晓婷, 鲁国东. OsOPR10正调控水稻对稻瘟病和白叶枯病的抗性[J]. 中国水稻科学, 2024, 38(4): 364-374. |
| [4] | 候小琴, 王莹, 余贝, 符卫蒙, 奉保华, 沈煜潮, 谢杭军, 王焕然, 许用强, 武志海, 王建军, 陶龙兴, 符冠富. 黄腐酸钾提高水稻秧苗耐盐性的作用途径分析[J]. 中国水稻科学, 2024, 38(4): 409-421. |
| [5] | 胡继杰, 胡志华, 张均华, 曹小闯, 金千瑜, 章志远, 朱练峰. 根际饱和溶解氧对水稻分蘖期光合及生长特性的影响[J]. 中国水稻科学, 2024, 38(4): 437-446. |
| [6] | 刘福祥, 甄浩洋, 彭焕, 郑刘春, 彭德良, 文艳华. 广东省水稻孢囊线虫病调查与鉴定[J]. 中国水稻科学, 2024, 38(4): 456-461. |
| [7] | 陈浩田, 秦缘, 钟笑涵, 林晨语, 秦竞航, 杨建昌, 张伟杨. 水稻根系和土壤性状与稻田甲烷排放关系的研究进展[J]. 中国水稻科学, 2024, 38(3): 233-245. |
| [8] | 缪军, 冉金晖, 徐梦彬, 卜柳冰, 王平, 梁国华, 周勇. 过量表达异三聚体G蛋白γ亚基基因RGG2提高水稻抗旱性[J]. 中国水稻科学, 2024, 38(3): 246-255. |
| [9] | 尹潇潇, 张芷菡, 颜绣莲, 廖蓉, 杨思葭, 郭岱铭, 樊晶, 赵志学, 王文明. 多个稻曲病菌效应因子的信号肽验证和表达分析[J]. 中国水稻科学, 2024, 38(3): 256-265. |
| [10] | 朱裕敬, 桂金鑫, 龚成云, 罗新阳, 石居斌, 张海清, 贺记外. 全基因组关联分析定位水稻分蘖角度QTL[J]. 中国水稻科学, 2024, 38(3): 266-276. |
| [11] | 魏倩倩, 汪玉磊, 孔海民, 徐青山, 颜玉莲, 潘林, 迟春欣, 孔亚丽, 田文昊, 朱练峰, 曹小闯, 张均华, 朱春权. 信号分子硫化氢参与硫肥缓解铝对水稻生长抑制作用的机制[J]. 中国水稻科学, 2024, 38(3): 290-302. |
| [12] | 周甜, 吴少华, 康建宏, 吴宏亮, 杨生龙, 王星强, 李昱, 黄玉峰. 不同种植模式对水稻籽粒淀粉含量及淀粉关键酶活性的影响[J]. 中国水稻科学, 2024, 38(3): 303-315. |
| [13] | 关雅琪, 鄂志国, 王磊, 申红芳. 影响中国水稻生产环节外包发展因素的实证研究:基于群体效应视角[J]. 中国水稻科学, 2024, 38(3): 324-334. |
| [14] | 许用强, 姜宁, 奉保华, 肖晶晶, 陶龙兴, 符冠富. 水稻开花期高温热害响应机理及其调控技术研究进展[J]. 中国水稻科学, 2024, 38(2): 111-126. |
| [15] | 吕海涛, 李建忠, 鲁艳辉, 徐红星, 郑许松, 吕仲贤. 稻田福寿螺的发生、危害及其防控技术研究进展[J]. 中国水稻科学, 2024, 38(2): 127-139. |
| 阅读次数 | ||||||
|
全文 |
|
|||||
|
摘要 |
|
|||||