中国水稻科学 ›› 2017, Vol. 31 ›› Issue (5): 513-523.DOI: 10.16819/j.1001-7216.2017.7048 513
褚光, 陈婷婷, 陈松, 徐春梅, 王丹英, 章秀福*( )
)
收稿日期:2017-04-28
修回日期:2017-06-10
出版日期:2017-10-10
发布日期:2017-09-10
通讯作者:
章秀福
基金资助:
Guang CHU, Tingting CHEN, Song CHEN, Chunmei XU, Danying WANG, Xiufu ZHANG*()
Received:2017-04-28
Revised:2017-06-10
Online:2017-10-10
Published:2017-09-10
Contact:
Xiufu ZHANG
摘要:
目的 研究不同水、氮管理模式对水稻产量以及水、氮利用效率的影响,以期为水稻高产与水、氮高效利用提供理论依据和技术参考。方法 大田试验于2015–2016年在浙江富阳进行,供试品种为三系籼型杂交稻天优华占。设置常规灌溉(CI)和干湿交替灌溉(AWD)两种灌溉模式,同时设置低氮(LN, 80 kg/hm2)、中氮(MN, 160 kg/hm2)和高氮(HN, 240 kg/hm2)3种施氮水平。结果 灌溉模式与施氮量对水稻产量以及水、氮利用效率有显著互作效应。与CI相比,AWD抑制无效分蘖,分蘖成穗率提高8.1%~10.7%;提高抽穗期至成熟期的光合势(LAD)与群体生长率(CGR);促进根系下扎,10~20 cm根层根系生物量增加了24.4%~32.3%,同时提高了结实期根系活性;促使茎鞘中非结构性碳水化合物(NSC)向籽粒中运转;且AWD在160 kg/hm2(中氮)施氮水平下可显著提高产量与水、氮利用效率,为本研究最佳的水、氮运筹模式。结论 通过适宜的水、氮运筹可充分发挥其互作效应,提高水稻产量与水、氮利用效率。
中图分类号:
褚光, 陈婷婷, 陈松, 徐春梅, 王丹英, 章秀福. 灌溉模式与施氮量交互作用对水稻产量以及水、氮利用效率的影响[J]. 中国水稻科学, 2017, 31(5): 513-523.
Guang CHU, Tingting CHEN, Song CHEN, Chunmei XU, Danying WANG, Xiufu ZHANG. Effects of Interaction Between Irrigation Regimes and Nitrogen Rates on Rice Yield and Water and Nitrogen Use Efficiencies[J]. Chinese Journal OF Rice Science, 2017, 31(5): 513-523.
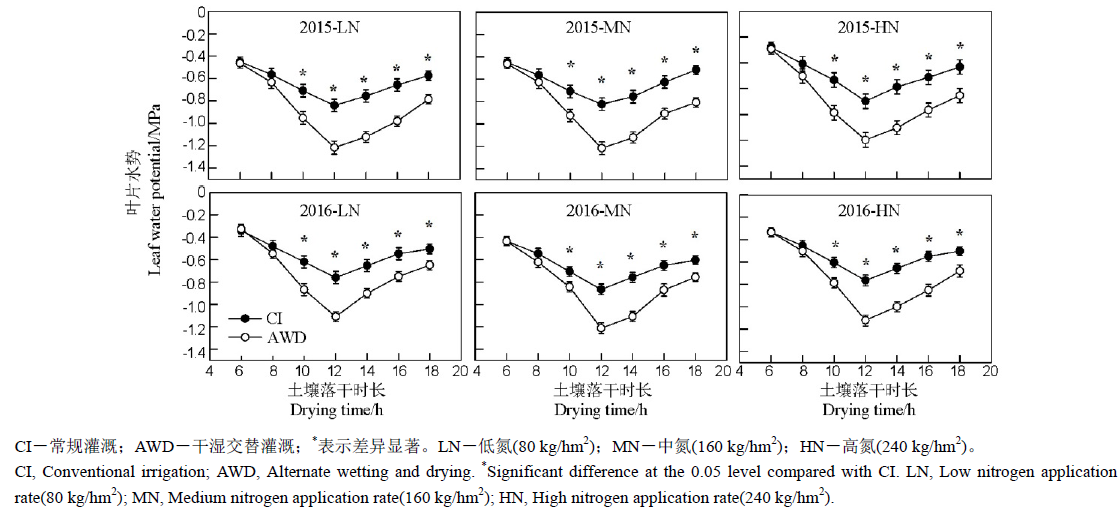
图1 灌溉模式与施氮量交互作用对水稻叶片水势的影响
Fig. 1. Effects of the interaction between irrigation regimes and nitrogen rates on diurnal changes in leaf water potentials of rice.
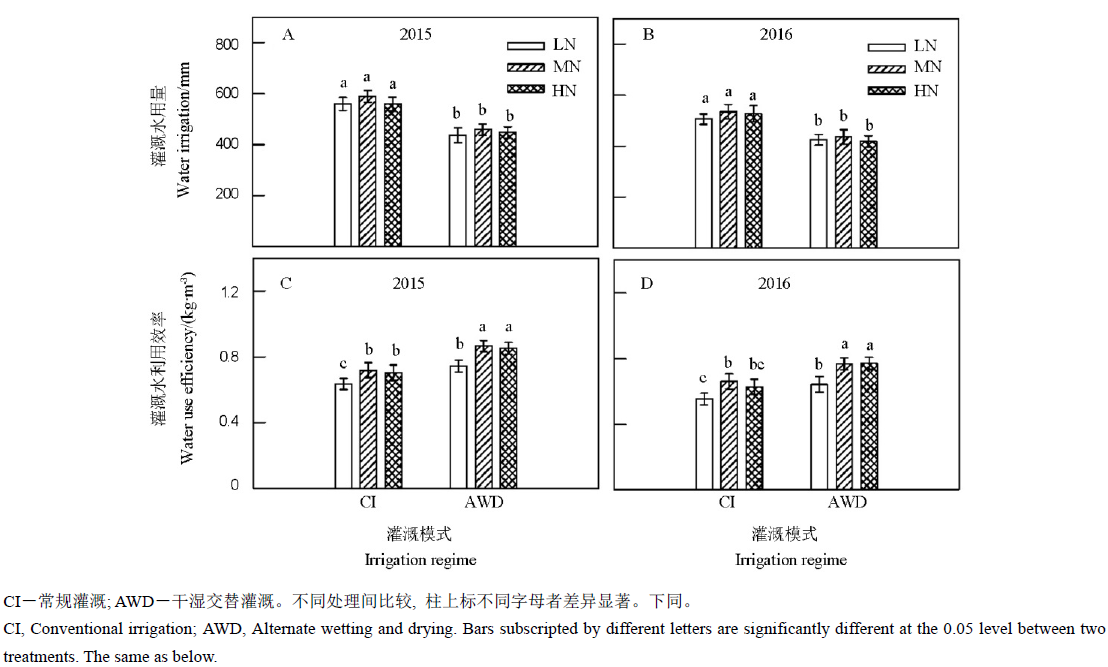
图2 灌溉模式与施氮量交互作用对灌溉用水量(A~B)与水分利用效率(C~D)的影响
Fig. 2. Effects of interaction between irrigation regimes and nitrogen rates on the amount of irrigated water (A–B) and water use efficiency(C–D).
| 年度与处理 Year and treatment | 产量 Grain yield/(t·hm-2) | 单位面积穗数 No.of panicles/(×104 hm-2) | 每穗粒数 Spikelets per panicle | 结实率 Seed setting rate/% | 千粒重 1000-grain weight/g |
|---|---|---|---|---|---|
| 2015 | |||||
| CI+LN | 7.34±0.22 d | 245.4±3.9 b | 143.2±2.5 d | 82.5±1.0 b | 25.4±0.3 a |
| CI+MN | 8.53±0.23 b | 284.2±5.5 a | 150.8±1.8 c | 78.9±1.2 c | 25.2±0.2 ab |
| CI+HN | 8.12±0.15 c | 286.4±5.3 a | 156.2±2.3 b | 72.5±1.3 d | 25.1±0.2 b |
| AWD+LN | 8.06±0.20 c | 243.5±4.1 b | 146.3±2.1 d | 89.1±1.5 a | 25.5±0.2 a |
| AWD+MN | 9.20±0.26 a | 279.9±5.5 a | 154.9±3.1 b | 83.5±1.0 b | 25.4±0.2 a |
| AWD+HN | 9.03±0.28 a | 282.5±4.9 a | 162.4±2.6 a | 78.1±1.8 c | 25.3±0.2 ab |
| 2016 | |||||
| CI+LN | 7.18±0.12 e | 224.4±3.8 b | 150.3±2.2 d | 84.8±1.0 bc | 25.2±0.4 a |
| CI+MN | 8.83±0.20 b | 274.2±4.8 a | 155.2±2.7 c | 82.8±0.8 c | 25.1±0.2 a |
| CI+HN | 8.40±0.18 c | 272.9±5.2 a | 162.3±3.7 ab | 75.4±1.5 d | 25.2±0.1 a |
| AWD+LN | 7.78±0.24 d | 225.3±4.2 b | 153.8±4.2 c | 88.7±0.9 a | 25.3±0.2 a |
| AWD+MN | 9.38±0.21 a | 270.8±3.5 a | 160.2±1.6 b | 85.8±1.1 b | 25.2±0.3 a |
| AWD+HN | 9.27±0.29 a | 270.5±4.4 a | 164.2±2.1 a | 83.1±1.4 c | 25.2±0.2 a |
表1 灌溉模式与施氮量交互作用对水稻产量及其构成因素的影响
Table 1 Effects of interaction between irrigation regimes and nitrogen rates on grain its and its components.
| 年度与处理 Year and treatment | 产量 Grain yield/(t·hm-2) | 单位面积穗数 No.of panicles/(×104 hm-2) | 每穗粒数 Spikelets per panicle | 结实率 Seed setting rate/% | 千粒重 1000-grain weight/g |
|---|---|---|---|---|---|
| 2015 | |||||
| CI+LN | 7.34±0.22 d | 245.4±3.9 b | 143.2±2.5 d | 82.5±1.0 b | 25.4±0.3 a |
| CI+MN | 8.53±0.23 b | 284.2±5.5 a | 150.8±1.8 c | 78.9±1.2 c | 25.2±0.2 ab |
| CI+HN | 8.12±0.15 c | 286.4±5.3 a | 156.2±2.3 b | 72.5±1.3 d | 25.1±0.2 b |
| AWD+LN | 8.06±0.20 c | 243.5±4.1 b | 146.3±2.1 d | 89.1±1.5 a | 25.5±0.2 a |
| AWD+MN | 9.20±0.26 a | 279.9±5.5 a | 154.9±3.1 b | 83.5±1.0 b | 25.4±0.2 a |
| AWD+HN | 9.03±0.28 a | 282.5±4.9 a | 162.4±2.6 a | 78.1±1.8 c | 25.3±0.2 ab |
| 2016 | |||||
| CI+LN | 7.18±0.12 e | 224.4±3.8 b | 150.3±2.2 d | 84.8±1.0 bc | 25.2±0.4 a |
| CI+MN | 8.83±0.20 b | 274.2±4.8 a | 155.2±2.7 c | 82.8±0.8 c | 25.1±0.2 a |
| CI+HN | 8.40±0.18 c | 272.9±5.2 a | 162.3±3.7 ab | 75.4±1.5 d | 25.2±0.1 a |
| AWD+LN | 7.78±0.24 d | 225.3±4.2 b | 153.8±4.2 c | 88.7±0.9 a | 25.3±0.2 a |
| AWD+MN | 9.38±0.21 a | 270.8±3.5 a | 160.2±1.6 b | 85.8±1.1 b | 25.2±0.3 a |
| AWD+HN | 9.27±0.29 a | 270.5±4.4 a | 164.2±2.1 a | 83.1±1.4 c | 25.2±0.2 a |
| 年度与处理 Year and Treatment | 植株吸氮量 N uptake of plants/(kg·hm-2) | 籽粒吸氮量 N uptake of grains/(kg·hm-2) | 产谷利用效率 IEN/(kg·kg-1) | 氮肥偏生产力 PFPN/(kg·kg-1) | 氮收获指数 HIN/% |
|---|---|---|---|---|---|
| 2015 | |||||
| CI+LN | 106.2±4.5 c | 66.7±2.2 d | 69.5±2.5 b | 91.8±3.2 b | 63.1±1.1 b |
| CI+MN | 134.8±3.2 b | 82.0±1.8 b | 63.2±3.3 c | 53.3±1.8 d | 60.8±0.8 c |
| CI+HN | 140.8±4.7 a | 76.1±3.0 c | 57.4±1.8 d | 33.8±1.9 f | 53.8±0.5 d |
| AWD+LN | 109.3±5.1 c | 73.7±2.4 c | 73.8±2.3 a | 100.8±2.1 a | 67.5±0.9 a |
| AWD+MN | 132.4±3.0 b | 86.0±1.9 a | 69.7±3.0 b | 57.5±2.5 c | 65.1±0.9 ab |
| AWD+HN | 140.2±3.3 a | 86.3±1.5 a | 64.5±2.8 c | 37.6±1.5 e | 61.7±1.3 bc |
| 2016 | |||||
| CI+LN | 108.4±4.2 c | 66.1±3.2 d | 66.7±2.4 bc | 89.8±1.8 b | 61.8±1.2 bc |
| CI+MN | 136.9±3.4 b | 79.4±1.8 b | 64.5±2.1 c | 55.2±2.2 d | 58.0±1.0 c |
| CI+HN | 138.7±2. 9 ab | 73.1±1.7 c | 60.5±1.4 d | 35.0±1.6 f | 52.6±0.8 d |
| AWD+LN | 110.4±3.3 c | 75.0±2.3 bc | 70.9±1.7 a | 97.2±2.4 a | 68.4±0.8 a |
| AWD+MN | 140.2±4.8 ab | 88.0±2.4 a | 67.2±2.1 b | 58.6±1.4 c | 63.1±0.9 b |
| AWD+HN | 144.3±3.5 a | 87.4±1.9 a | 63.5±2.3 c | 38.6±1.3 e | 60.8±0.7 c |
表2 灌溉模式与施氮量交互作用对水稻氮肥利用效率的影响
Table 2 Effects of interaction between irrigation regimes and nitrogen rates on nitrogen use efficiency of rice.
| 年度与处理 Year and Treatment | 植株吸氮量 N uptake of plants/(kg·hm-2) | 籽粒吸氮量 N uptake of grains/(kg·hm-2) | 产谷利用效率 IEN/(kg·kg-1) | 氮肥偏生产力 PFPN/(kg·kg-1) | 氮收获指数 HIN/% |
|---|---|---|---|---|---|
| 2015 | |||||
| CI+LN | 106.2±4.5 c | 66.7±2.2 d | 69.5±2.5 b | 91.8±3.2 b | 63.1±1.1 b |
| CI+MN | 134.8±3.2 b | 82.0±1.8 b | 63.2±3.3 c | 53.3±1.8 d | 60.8±0.8 c |
| CI+HN | 140.8±4.7 a | 76.1±3.0 c | 57.4±1.8 d | 33.8±1.9 f | 53.8±0.5 d |
| AWD+LN | 109.3±5.1 c | 73.7±2.4 c | 73.8±2.3 a | 100.8±2.1 a | 67.5±0.9 a |
| AWD+MN | 132.4±3.0 b | 86.0±1.9 a | 69.7±3.0 b | 57.5±2.5 c | 65.1±0.9 ab |
| AWD+HN | 140.2±3.3 a | 86.3±1.5 a | 64.5±2.8 c | 37.6±1.5 e | 61.7±1.3 bc |
| 2016 | |||||
| CI+LN | 108.4±4.2 c | 66.1±3.2 d | 66.7±2.4 bc | 89.8±1.8 b | 61.8±1.2 bc |
| CI+MN | 136.9±3.4 b | 79.4±1.8 b | 64.5±2.1 c | 55.2±2.2 d | 58.0±1.0 c |
| CI+HN | 138.7±2. 9 ab | 73.1±1.7 c | 60.5±1.4 d | 35.0±1.6 f | 52.6±0.8 d |
| AWD+LN | 110.4±3.3 c | 75.0±2.3 bc | 70.9±1.7 a | 97.2±2.4 a | 68.4±0.8 a |
| AWD+MN | 140.2±4.8 ab | 88.0±2.4 a | 67.2±2.1 b | 58.6±1.4 c | 63.1±0.9 b |
| AWD+HN | 144.3±3.5 a | 87.4±1.9 a | 63.5±2.3 c | 38.6±1.3 e | 60.8±0.7 c |
| 年度与处理 Year and Treatment | 分蘖数 Number of tillers per m2 | 分蘖成穗率 Percentage of productive tillers/% | ||
|---|---|---|---|---|
| 拔节期 Jointing stage | 抽穗期 Heading time | 成熟期 Maturity | ||
| 2015 | ||||
| CI+LN | 289.3±4.8 e | 198.4±3.2 b | 195.3±2.7 b | 67.5±1.0 d |
| CI+MN | 356.2±6.6 b | 236.4±2.8 a | 234.2±3.6 a | 65.8±1.3 d |
| CI+HN | 387.8±6.6 a | 237.8±4.2 a | 235.8±3.1 a | 60.9±3.5 e |
| AWD+LN | 247.3±5.1 f | 195.2±2.6 b | 192.8±2.4 b | 78.2±2.0 a |
| AWD+MN | 310.4±7.7 d | 234.8±2.0 a | 230.0±3.2 a | 74.1±1.6 b |
| AWD+HN | 331.8±5.2 c | 236.4±3.3 a | 231.7±2.2 a | 69.8±1.2 c |
| 2016 | ||||
| CI+LN | 248.7±5.4 e | 176.9±2.7 b | 174.2±3.2 b | 69.8±0.9 b |
| CI+MN | 348.2±6.2 b | 227.8±3.3 a | 224.1±1.8 a | 64.3±1.9 c |
| CI+HN | 376.8±4.6 a | 227.3±4.1 a | 223.4±2.2 a | 59.1±1.8 d |
| AWD+LN | 225.4±6.4 f | 180.4±3.5 b | 175.2±2.0 b | 77.9±1.4 a |
| AWD+MN | 294.0±7.3 d | 224.8±2.8 a | 220.8±1.9 a | 75.1±2.1 a |
| AWD+HN | 306.6±5.3 c | 224.3±4.1 a | 219.7±2.4 a | 71.7±1.6 b |
表3 灌溉模式与施氮量交互作用对水稻分蘖数与分蘖成穗率的影响
Table 3 Effects of interaction between irrigation regimes and nitrogen rates on number of tillers and percentage of productive tillers of rice.
| 年度与处理 Year and Treatment | 分蘖数 Number of tillers per m2 | 分蘖成穗率 Percentage of productive tillers/% | ||
|---|---|---|---|---|
| 拔节期 Jointing stage | 抽穗期 Heading time | 成熟期 Maturity | ||
| 2015 | ||||
| CI+LN | 289.3±4.8 e | 198.4±3.2 b | 195.3±2.7 b | 67.5±1.0 d |
| CI+MN | 356.2±6.6 b | 236.4±2.8 a | 234.2±3.6 a | 65.8±1.3 d |
| CI+HN | 387.8±6.6 a | 237.8±4.2 a | 235.8±3.1 a | 60.9±3.5 e |
| AWD+LN | 247.3±5.1 f | 195.2±2.6 b | 192.8±2.4 b | 78.2±2.0 a |
| AWD+MN | 310.4±7.7 d | 234.8±2.0 a | 230.0±3.2 a | 74.1±1.6 b |
| AWD+HN | 331.8±5.2 c | 236.4±3.3 a | 231.7±2.2 a | 69.8±1.2 c |
| 2016 | ||||
| CI+LN | 248.7±5.4 e | 176.9±2.7 b | 174.2±3.2 b | 69.8±0.9 b |
| CI+MN | 348.2±6.2 b | 227.8±3.3 a | 224.1±1.8 a | 64.3±1.9 c |
| CI+HN | 376.8±4.6 a | 227.3±4.1 a | 223.4±2.2 a | 59.1±1.8 d |
| AWD+LN | 225.4±6.4 f | 180.4±3.5 b | 175.2±2.0 b | 77.9±1.4 a |
| AWD+MN | 294.0±7.3 d | 224.8±2.8 a | 220.8±1.9 a | 75.1±2.1 a |
| AWD+HN | 306.6±5.3 c | 224.3±4.1 a | 219.7±2.4 a | 71.7±1.6 b |
| 年度与处理 Year and Treatment | 拔节期 Jointing | 抽穗期 Heading | 成熟期 Maturity |
|---|---|---|---|
| 2015 | |||
| CI+LN | 4.23±0.15 d | 6.12±0.13 d | 0.75±0.11 f |
| CI+MN | 5.72±0.13 b | 7.44±0.27 bc | 1.69±0.08 c |
| CI+HN | 6.12±0.19 a | 8.05±0.28 a | 1.31±0.09 d |
| AWD+LN | 3.98±0.24 e | 6.04±0.17 d | 1.05±0.10 e |
| AWD+MN | 5.14±0.15 c | 7.25±0.15 c | 1.94±0.05 b |
| AWD+HN | 5.84±0.28 ab | 7.64±0.20 b | 2.16±0.06 a |
| 2016 | |||
| CI+LN | 4.45±0.19 c | 6.31±0.21 d | 0.84±0.15 e |
| CI+MN | 5.51±0.32 b | 7.61±0.12 b | 1.52±0.06 c |
| CI+HN | 6.27±0.28 a | 7.94±0.22 a | 1.21±0.09 d |
| AWD+LN | 4.09±0.17 d | 6.19±0.17 d | 1.04±0.11 de |
| AWD+MN | 4.64±0.35 c | 7.17±0.23 c | 1.85±0.10 b |
| AWD+HN | 5.69±0.26 b | 7.68±0.14 b | 2.04±0.08 a |
表4 灌溉模式与施氮量交互作用对水稻叶面积指数(LAI)的影响
Table 4 Effects of interaction between irrigation regimes and nitrogen rates on LAI of rice.
| 年度与处理 Year and Treatment | 拔节期 Jointing | 抽穗期 Heading | 成熟期 Maturity |
|---|---|---|---|
| 2015 | |||
| CI+LN | 4.23±0.15 d | 6.12±0.13 d | 0.75±0.11 f |
| CI+MN | 5.72±0.13 b | 7.44±0.27 bc | 1.69±0.08 c |
| CI+HN | 6.12±0.19 a | 8.05±0.28 a | 1.31±0.09 d |
| AWD+LN | 3.98±0.24 e | 6.04±0.17 d | 1.05±0.10 e |
| AWD+MN | 5.14±0.15 c | 7.25±0.15 c | 1.94±0.05 b |
| AWD+HN | 5.84±0.28 ab | 7.64±0.20 b | 2.16±0.06 a |
| 2016 | |||
| CI+LN | 4.45±0.19 c | 6.31±0.21 d | 0.84±0.15 e |
| CI+MN | 5.51±0.32 b | 7.61±0.12 b | 1.52±0.06 c |
| CI+HN | 6.27±0.28 a | 7.94±0.22 a | 1.21±0.09 d |
| AWD+LN | 4.09±0.17 d | 6.19±0.17 d | 1.04±0.11 de |
| AWD+MN | 4.64±0.35 c | 7.17±0.23 c | 1.85±0.10 b |
| AWD+HN | 5.69±0.26 b | 7.68±0.14 b | 2.04±0.08 a |
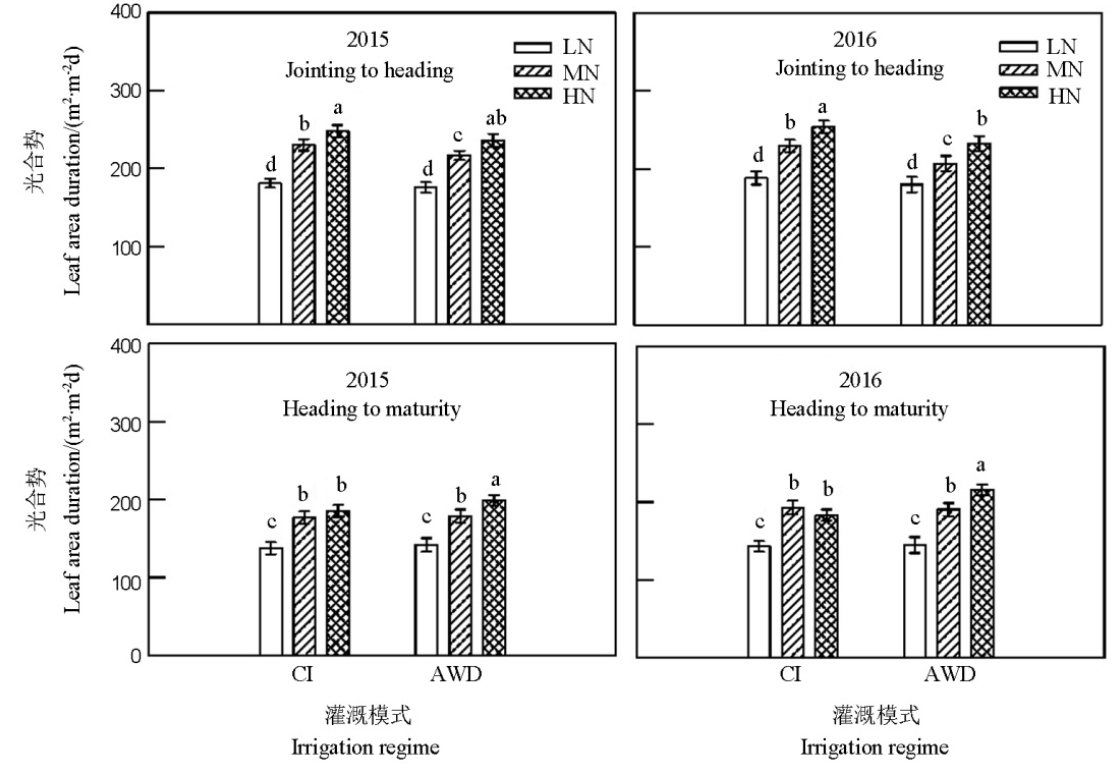
图3 灌溉模式与施氮量交互作用对水稻光合势的影响
Fig. 3. Effects of interaction between irrigation regimes and nitrogen rates on leaf area duration.
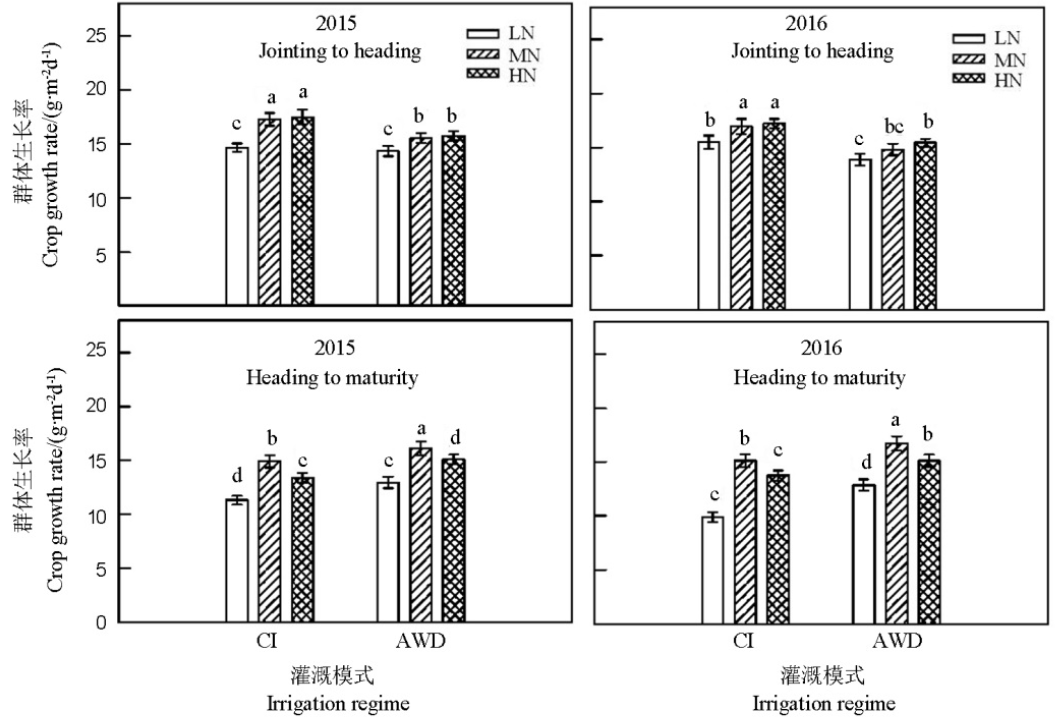
图4 灌溉模式与施氮量交互作用对水稻群体生长率的影响
Fig. 4. Effects of interaction between irrigation regimes and nitrogen rates on crop growth rate.
| 年度与处理 Year and Treatment | 地上部干物质量Shoot dry weight/(t·hm-2) | 抽穗期根干质量Root dry weight at heading/(g·m-2) | ||||||
|---|---|---|---|---|---|---|---|---|
| 拔节期 Jointing | 抽穗期 Heading | 成熟期 Maturity | 0~10 cm根层 0-10 cm soil layer | 10~20 cm根层 10-20 cm soil layer | ||||
| 2015 | ||||||||
| CI+LN | 3.58±0.12 c | 8.27±0.38 d | 12.8±0.2 c | 66.0±2.9 b | 28.3±1.1 b | |||
| CI+MN | 4.02±0.13 b | 9.54±0.22 b | 15.5±0.3 a | 76.4±2.5 a | 31.2±2.1 b | |||
| CI+HN | 4.51±0.08 a | 10.10±0.31 a | 15.5±0.3 a | 75.3±3.2 a | 31.0±1.4 b | |||
| AWD+LN | 3.43±0.09 c | 8.02±0.21 d | 13.2±0.3 b | 67.4±2.5 b | 36.3±0.9 ab | |||
| AWD+MN | 3.97±0.15 b | 8.95±0.32 c | 15.4±0.2 a | 80.0±1.6 a | 39.3±2.0 a | |||
| AWD+HN | 4.42±0.11 a | 9.46±0.25 b | 15.5±0.4 a | 79.4±2.2 a | 39.1±1.5 a | |||
| 2016 | ||||||||
| CI+LN | 3.34±0.09 c | 8.45±0.26 d | 12.4±0.2 c | 60.7±1.2 c | 26.0±1.3 c | |||
| CI+MN | 4.26±0.07 b | 9.85±0.29 b | 15.9±0.4 a | 72.1±2.7 a | 29.8±1.7 b | |||
| CI+HN | 4.52±0.11 a | 10.20±0.16 a | 15.7±0.2 a | 73.8±2.9 a | 30.4±2.0 b | |||
| AWD+LN | 3.28±0.14 c | 7.86±0.31 e | 13.0±0.2 b | 64.0±1.9 b | 34.4±1.6 ab | |||
| AWD+MN | 4.12±0.07 b | 9.01±0.25 c | 15.7±0.3 a | 75.3±2.1 a | 37.1±0.9 a | |||
| AWD+HN | 4.65±0.15 a | 9.75±0.20 b | 15.8±0.3 a | 75.1±3.2 a | 38.7±1.4 a | |||
表5 灌溉模式与施氮量交互作用对水稻地上部干物质量与抽穗期根干质量的影响
Table 5 Effects of interaction between irrigation regimes and nitrogen rates on shoot dry weight and root dry weight at heading in rice.
| 年度与处理 Year and Treatment | 地上部干物质量Shoot dry weight/(t·hm-2) | 抽穗期根干质量Root dry weight at heading/(g·m-2) | ||||||
|---|---|---|---|---|---|---|---|---|
| 拔节期 Jointing | 抽穗期 Heading | 成熟期 Maturity | 0~10 cm根层 0-10 cm soil layer | 10~20 cm根层 10-20 cm soil layer | ||||
| 2015 | ||||||||
| CI+LN | 3.58±0.12 c | 8.27±0.38 d | 12.8±0.2 c | 66.0±2.9 b | 28.3±1.1 b | |||
| CI+MN | 4.02±0.13 b | 9.54±0.22 b | 15.5±0.3 a | 76.4±2.5 a | 31.2±2.1 b | |||
| CI+HN | 4.51±0.08 a | 10.10±0.31 a | 15.5±0.3 a | 75.3±3.2 a | 31.0±1.4 b | |||
| AWD+LN | 3.43±0.09 c | 8.02±0.21 d | 13.2±0.3 b | 67.4±2.5 b | 36.3±0.9 ab | |||
| AWD+MN | 3.97±0.15 b | 8.95±0.32 c | 15.4±0.2 a | 80.0±1.6 a | 39.3±2.0 a | |||
| AWD+HN | 4.42±0.11 a | 9.46±0.25 b | 15.5±0.4 a | 79.4±2.2 a | 39.1±1.5 a | |||
| 2016 | ||||||||
| CI+LN | 3.34±0.09 c | 8.45±0.26 d | 12.4±0.2 c | 60.7±1.2 c | 26.0±1.3 c | |||
| CI+MN | 4.26±0.07 b | 9.85±0.29 b | 15.9±0.4 a | 72.1±2.7 a | 29.8±1.7 b | |||
| CI+HN | 4.52±0.11 a | 10.20±0.16 a | 15.7±0.2 a | 73.8±2.9 a | 30.4±2.0 b | |||
| AWD+LN | 3.28±0.14 c | 7.86±0.31 e | 13.0±0.2 b | 64.0±1.9 b | 34.4±1.6 ab | |||
| AWD+MN | 4.12±0.07 b | 9.01±0.25 c | 15.7±0.3 a | 75.3±2.1 a | 37.1±0.9 a | |||
| AWD+HN | 4.65±0.15 a | 9.75±0.20 b | 15.8±0.3 a | 75.1±3.2 a | 38.7±1.4 a | |||
| 年度与处理 Year and Treatment | 剑叶净光合速率 Leaf photosynthetic rate/(µmol·m-2 s-1) | 根系氧化力 Root oxidation activity/(µg·g-1 h-1) | |||||||
|---|---|---|---|---|---|---|---|---|---|
| D1 | W1 | D2 | W2 | D1 | W1 | D2 | W2 | ||
| 2015 | |||||||||
| CI+LN | 17.4±0.5 b | 16.9±0.5 c | 13.9±0.6 c | 13.6±0.7 e | 408.7±22.5 b | 414.3±19.5 d | 261.7±16.6 c | 254.3±21.9 d | |
| CI+MN | 21.5±0.5 a | 21.0±0.5 b | 17.1±0.5 a | 16.6±0.6 c | 595.2±26.5 a | 587.3±14.6 b | 392.4±17.5 a | 379.8±15.5 b | |
| CI+HN | 21.9±0.7 a | 21.7±0.4 b | 15.1±0.5 b | 15.0±0.5 d | 611.0±27.4 a | 599.7±27.8 b | 354.3±16.9 b | 336.8±17.6 c | |
| AWD+LN | 16.9±0.5 b | 21.7±0.4 b | 13.6±0.7 c | 18.3±0.8 b | 398.8±31.2 b | 547.3±18.2 c | 270.3±23.5 c | 358.7±25.5 bc | |
| AWD+MN | 20.7±0.5 a | 25.2±0.6 a | 16.8±0.7 a | 21.5±0.6 a | 589.7±19.4 a | 650.3±16.5 a | 403.8±13.4 a | 454.3±24.8 a | |
| AWD+HN | 21.5±0.5 a | 25.3±0.6 a | 17.9±0.5 a | 22.6±0.5 a | 600.4±16.4 a | 665.7±13.4 a | 406.7±24.8 a | 486.8±19.7 a | |
| 2016 | |||||||||
| CI+LN | 16.6±0.6 b | 17.1±0.5 c | 14.2±0.5 c | 13.8±0.6 e | 436.2±22.2 b | 420.3±16.9 d | 270.3±16.8 c | 251.8±25.5 d | |
| CI+MN | 19.9±0.8 a | 20.2±0.6 b | 17.4±0.5 a | 17.3±0.7 c | 625.5±23.1 a | 608.3±19.5 b | 393.8±25.1 a | 388.7±21.3 b | |
| CI+HN | 20.7±0.6 a | 21.3±0.8 b | 16.3±0.8 b | 15.1±0.8 d | 616.3±24.8 a | 624.4±15.5 b | 342.0±21.5 b | 348.4±15.1 c | |
| AWD+LN | 16.1±0.5 b | 20.6±0.4 b | 13.8±0.8 c | 18.2±0.8 b | 418.3±24.5 b | 568.7±22.4 c | 260.3±24.6 c | 390.5±22.7 b | |
| AWD+MN | 19.4±0.7 a | 24.5±0.6 a | 17.3±0.6 a | 21.2±0.5 a | 607.8±11.5 a | 658.7±12.8 a | 389.0±31.8 a | 454.2±27.9 a | |
| AWD+HN | 20.2±0.5 a | 23.5±0.5 a | 18.3±0.8 a | 22.7±0.7 a | 625.3±19.8 a | 670.3±20.5 a | 403.8±22.7 a | 488.5±27.2 a | |
表6 灌溉模式与施氮量交互作用对剑叶净光合速率与根系氧化力的影响
Table 6 Effects of interaction between irrigation regimes and nitrogen rates on photosynthetic rate of the flag leaf and root oxidation activity of rice during grain filling.
| 年度与处理 Year and Treatment | 剑叶净光合速率 Leaf photosynthetic rate/(µmol·m-2 s-1) | 根系氧化力 Root oxidation activity/(µg·g-1 h-1) | |||||||
|---|---|---|---|---|---|---|---|---|---|
| D1 | W1 | D2 | W2 | D1 | W1 | D2 | W2 | ||
| 2015 | |||||||||
| CI+LN | 17.4±0.5 b | 16.9±0.5 c | 13.9±0.6 c | 13.6±0.7 e | 408.7±22.5 b | 414.3±19.5 d | 261.7±16.6 c | 254.3±21.9 d | |
| CI+MN | 21.5±0.5 a | 21.0±0.5 b | 17.1±0.5 a | 16.6±0.6 c | 595.2±26.5 a | 587.3±14.6 b | 392.4±17.5 a | 379.8±15.5 b | |
| CI+HN | 21.9±0.7 a | 21.7±0.4 b | 15.1±0.5 b | 15.0±0.5 d | 611.0±27.4 a | 599.7±27.8 b | 354.3±16.9 b | 336.8±17.6 c | |
| AWD+LN | 16.9±0.5 b | 21.7±0.4 b | 13.6±0.7 c | 18.3±0.8 b | 398.8±31.2 b | 547.3±18.2 c | 270.3±23.5 c | 358.7±25.5 bc | |
| AWD+MN | 20.7±0.5 a | 25.2±0.6 a | 16.8±0.7 a | 21.5±0.6 a | 589.7±19.4 a | 650.3±16.5 a | 403.8±13.4 a | 454.3±24.8 a | |
| AWD+HN | 21.5±0.5 a | 25.3±0.6 a | 17.9±0.5 a | 22.6±0.5 a | 600.4±16.4 a | 665.7±13.4 a | 406.7±24.8 a | 486.8±19.7 a | |
| 2016 | |||||||||
| CI+LN | 16.6±0.6 b | 17.1±0.5 c | 14.2±0.5 c | 13.8±0.6 e | 436.2±22.2 b | 420.3±16.9 d | 270.3±16.8 c | 251.8±25.5 d | |
| CI+MN | 19.9±0.8 a | 20.2±0.6 b | 17.4±0.5 a | 17.3±0.7 c | 625.5±23.1 a | 608.3±19.5 b | 393.8±25.1 a | 388.7±21.3 b | |
| CI+HN | 20.7±0.6 a | 21.3±0.8 b | 16.3±0.8 b | 15.1±0.8 d | 616.3±24.8 a | 624.4±15.5 b | 342.0±21.5 b | 348.4±15.1 c | |
| AWD+LN | 16.1±0.5 b | 20.6±0.4 b | 13.8±0.8 c | 18.2±0.8 b | 418.3±24.5 b | 568.7±22.4 c | 260.3±24.6 c | 390.5±22.7 b | |
| AWD+MN | 19.4±0.7 a | 24.5±0.6 a | 17.3±0.6 a | 21.2±0.5 a | 607.8±11.5 a | 658.7±12.8 a | 389.0±31.8 a | 454.2±27.9 a | |
| AWD+HN | 20.2±0.5 a | 23.5±0.5 a | 18.3±0.8 a | 22.7±0.7 a | 625.3±19.8 a | 670.3±20.5 a | 403.8±22.7 a | 488.5±27.2 a | |
| 年度与处理 Year and Treatment | 抽穗期NSC NSC at heading/(g·m-2) | 成熟期NSC NSC at maturity/(g·m-2) | NSC运转率 Remobilized NSC/% | NSC对产量贡献率 NSC contributed to grain yield /% |
|---|---|---|---|---|
| 2015 | ||||
| CI+LN | 202.3±4.41 c | 90.5±2.3 d | 55.3±1.4 b | 15.1±0.8 c |
| CI+MN | 252.4±3.26 b | 131±1.8 b | 47.9±1.3 d | 14.0±0.5 c |
| CI+HN | 257.1±3.83 b | 171±3.6 a | 33.4±2.7 e | 10.5±0.5 d |
| AWD+LN | 207.3±5.16 c | 80.7±3.2 d | 61.5±2.2 a | 16.1±0.3 b |
| AWD+MN | 257.8±6.88 b | 103±2.8 c | 60.2±3.0 a | 16.9±0.3 a |
| AWD+HN | 284.3±3.42 a | 139±2.5 b | 51.2±2.9 c | 15.9±0.4 b |
| 2016 | ||||
| CI+LN | 204.3±4.25 d | 91.7±3.2 d | 55.2±1.3 b | 15.8±0.5 b |
| CI+MN | 254.3±3.19 c | 137±2.8 b | 46.2±1.9 c | 13.5±0.6 c |
| CI+HN | 251.7±5.28 c | 175±3.6 a | 30.3±2.0 d | 9.32±0.7 d |
| AWD+LN | 211.7±6.51 d | 81.1±5.2 d | 61.8±1.3 a | 16.8±0.6 a |
| AWD+MN | 262.9±4.03 b | 107±2.8 c | 59.2±2.9 a | 16.6±0.5 a |
| AWD+HN | 291.7±4.92 a | 135±4.3 b | 53.6±3.0 b | 16.9±0.6 a |
表7 灌溉模式与施氮量交互作用对茎鞘中非结构性碳水化合物(NSC)运转的影响
Table 7 Effects of interaction between irrigation regimes and nitrogen rates on remobilization of non-structural carbohydrates(NSC) in culms and sheaths during grain filling.
| 年度与处理 Year and Treatment | 抽穗期NSC NSC at heading/(g·m-2) | 成熟期NSC NSC at maturity/(g·m-2) | NSC运转率 Remobilized NSC/% | NSC对产量贡献率 NSC contributed to grain yield /% |
|---|---|---|---|---|
| 2015 | ||||
| CI+LN | 202.3±4.41 c | 90.5±2.3 d | 55.3±1.4 b | 15.1±0.8 c |
| CI+MN | 252.4±3.26 b | 131±1.8 b | 47.9±1.3 d | 14.0±0.5 c |
| CI+HN | 257.1±3.83 b | 171±3.6 a | 33.4±2.7 e | 10.5±0.5 d |
| AWD+LN | 207.3±5.16 c | 80.7±3.2 d | 61.5±2.2 a | 16.1±0.3 b |
| AWD+MN | 257.8±6.88 b | 103±2.8 c | 60.2±3.0 a | 16.9±0.3 a |
| AWD+HN | 284.3±3.42 a | 139±2.5 b | 51.2±2.9 c | 15.9±0.4 b |
| 2016 | ||||
| CI+LN | 204.3±4.25 d | 91.7±3.2 d | 55.2±1.3 b | 15.8±0.5 b |
| CI+MN | 254.3±3.19 c | 137±2.8 b | 46.2±1.9 c | 13.5±0.6 c |
| CI+HN | 251.7±5.28 c | 175±3.6 a | 30.3±2.0 d | 9.32±0.7 d |
| AWD+LN | 211.7±6.51 d | 81.1±5.2 d | 61.8±1.3 a | 16.8±0.6 a |
| AWD+MN | 262.9±4.03 b | 107±2.8 c | 59.2±2.9 a | 16.6±0.5 a |
| AWD+HN | 291.7±4.92 a | 135±4.3 b | 53.6±3.0 b | 16.9±0.6 a |
| [1] | Fageria N.Plant tissue test for determination of optimum concentration and uptake of nitrogen at different growth stages in low land rice.Commun Soil Sci Plant Anal, 2003, 34(1): 259-270. |
| [2] | Belder P, Bouman B, Cabangon R, Guoan L, Quilang E, Li Y, Spiertz J, Tuong T.Effect of water-saving irrigation on rice yield and water use in typical lowland conditions in Asia.Agric Water Manag, 2004, 65(3): 193-210. |
| [3] | Bouman B.A conceptual framework for the improvement of cropwater productivity at different spatial scales.Agric Syst, 2007, 93(3): 43-60. |
| [4] | Borrell A, Garside A, Fukai S.Improving efficiency of water use for irrigated rice in a semi-arid tropical environment.Field Crops Res, 1997, 52(3): 231-248. |
| [5] | Carrijo D, Lundy M, Linquist B.Rice yields and water use under alternate wetting and drying irrigation: A meta-analysis.Field Crops Res, 2017, 203(3): 173-180. |
| [6] | FAOSTAT. FAO Statistical Databases, Food and Agriculture Organization (FAO) of the United Nations, Rome, 2013. .[<date-in-citation content-type="access-date">2017-09 -05</date-in-citation>]. |
| [7] | Peng S, Buresh R, Huang J, Zhong X, Zou Y, Yang J, Wang G, Liu Y, Tang Q, Cui K, Zhang F, Dobermann A.Improving nitrogen fertilization in rice by site-specific N management: A review.Agron Sustain Dev, 2010, 30(3): 649-656. |
| [8] | Ju X, Xing G, Chen X, Zhang S, Zhang L, Liu X, Cui Z, Yin B, Christiea P, Zhu Z, Zhang F.Reducing environmental risk by improving N management in intensive Chinese agricultural systems.Proc. Natl. Acad. Sci. U.S.A, 2009, 106(19), 3041-3046. |
| [9] | 杨建昌, 王志琴, 朱庆森. 不同土壤水分状况下氮素营养对水稻产量的影响及其生理机制的研究. 中国农业科学, 1996, 29(4): 58-66. |
| Yang J C, Wang Z Q, Zhu Q S.Effect of nitrogen nutrition on rice yield and its physiological mechanism under different status of soil moisture.Sci Agric Sin, 1996, 29(4): 58-66. (in Chinese with English abstract) | |
| [10] | Cabangon R, Tuong T, Castillo E.Effect of irrigation method and N-fertilizer management on rice yield, water productivity and nutrient use efficiencies in typical lowland rice conditions in China.Paddy Water Environ, 2004, 2(4): 195-206. |
| [11] | Sharma B, KarS, Cheema S. Yield, water use and nitrogen uptake for different water and N levels in winter wheat. Fert Res, 1990, 22(1):119-127. |
| [12] | 杨建昌, 杜永, 刘辉. 长江下游稻麦周年超高产栽培途径与技术. 中国农业科学, 2008, 41(6): 1611-1621. |
| Yang J C, Du Y, Liu H.Cultivation approaches and techniques for annual super-high-yielding of rice and wheat in the lower reaches of Yangtze river. Sci Agric Sin, 2008, 41(6): 1611-1621. (in Chinese with English abstract) | |
| [13] | Chu G, Chen T, Wang Z, Yang J, Zhang J.Morphological and physiological traits of roots and their relationships with water productivity in water-saving and drought-resistant rice.Field Crops Res, 2014, 162(8): 108-119. |
| [14] | Chu G, Wang Z, Zhang H, Liu L, Yang J, Zhang J.Alternate wetting and moderate drying increases rice yield and reduces methane emission in paddy field with wheat straw residue incorporation.Food and Energy Sec, 2015, 4(3): 238-254. |
| [15] | 褚光, 展明飞, 朱宽宇, 王志琴, 杨建昌. 干湿交替灌溉对水稻产量与水分利用效率的影响. 作物学报, 2016, 42(7): 1026-1036. |
| Chu G, Zhan M F, Zhu K Y, Wang Z Q, Yang J C.Effects of alternate wetting and drying irrigation on yield and water use efficiency of rice.Acta Agron Sin, 2016, 42(7): 1026-1036. | |
| [16] | Fu J, Huang Z, Wang Z, Yang J, Zhang J.Pre-anthesis non-structural carbohydrate reserve in the stem enhances the sink strength of inferior spikelets during grain filling of rice.Field Crops Res, 2011, 123(2): 170-182. |
| [17] | Zhang Z, Chu G, Liu L, Wang Z, Yang J, Zhang J.Mid-season nitrogen application strategies for rice varieties differing in panicle size.Field Crops Res, 2013, 150: 9-18. |
| [18] | Boyer J, Westgate M.Grain yields with limited water. J Exp Bot, 2004, 55(407): 2385-2349. |
| [19] | Saini H, Westgate M.Reproductive development in grain crops during drought.Adv Agron, 2000, 68(2): 59-96. |
| [20] | Yang J, Zhang J, Liu K, et al.Abscisic acid and ethylene interact in rice spikelets in response to water stress during meiosis.J Plant Growth Regul, 2007, 26(4): 318-328. |
| [21] | Zhang H, Xue Y, Wang Z, Yang J, Zhang J.An alternate wetting and moderate soil drying regime improves root and shoot growth in rice. Crop Sci, 2009, 49(6): 2246-2260. |
| [22] | Takai T, Fukuta Y, Shirawa T, Horie T.Time-related mapping of quantitative trait loci controlling grain-filling in rice. J Exp Bot, 2005, 56, 2107-2118. |
| [23] | Ramasamy S, Berge H, Purushothaman S.Yield formation in rice in response to drainage and nitrogen application,Field Crops Res, 1997, 51(1): 65-82. |
| [24] | Ju C, Buresh R, Wang Z, Zhang H, Liu L, Yang J, Zhang J.Root and shoot traits for rice varieties with higher grain yield and higher nitrogen use efficiency at lower nitrogen rates application.Field Crops Res, 2015, 175: 47-55. |
| [25] | Yang C, Yang L, Yang X, Zhu O.Rice root growth and nutrient uptake as influenced by organic manure in continuously and alternately flooded paddy soils.Agr Water Manag, 2004, 70(1): 67-81. |
| [26] | Liu L, Chen T, Wang Z, Zhang H, Yang J, Zhang J.Combination of site-specific nitrogen management and alternate wetting and drying irrigation increases grain yield and nitrogen and water use efficiency in super rice.Field Crops Res, 2013, 154: 226-235. |
| [27] | Xue Y, Duan H, Liu L, Wang Z, Yang J, Zhang J.An improved crop management increases grain yield and nitrogen and water use efficiency in rice.Crop Sci, 2013, 53(1): 271-284. |
| [28] | Vitousek P, Mooney H, Lubchenco J, Melillo J.Human domination of earth’s ecosystems. Science, 1997, 277(5325) : 494-499. |
| [29] | Belder P, Spiertz J, Bouman B, Lu G, Tuong T.Nitrogen economy and water productivity of lowland rice under water-saving irrigation.Field Crops Res, 2005, 93(2): 169-185. |
| [30] | 王绍华, 曹卫星, 丁艳锋, 田永超, 姜东. 水氮互作对水稻氮吸收与利用的影响. 中国农业科学, 2004, 37(4): 497-501. |
| Wang S H, Cao W X, Ding Y F, Tian Y C, Jiang D.Interactions of water management and nitrogen fertilizer on nitrogen absorption and utilization in rice.Sci Agric Sin, 2004, 37(4): 497-501. (in Chinese with English abstract) |
| [1] | 郭展, 张运波. 水稻对干旱胁迫的生理生化响应及分子调控研究进展[J]. 中国水稻科学, 2024, 38(4): 335-349. |
| [2] | 韦还和, 马唯一, 左博源, 汪璐璐, 朱旺, 耿孝宇, 张翔, 孟天瑶, 陈英龙, 高平磊, 许轲, 霍中洋, 戴其根. 盐、干旱及其复合胁迫对水稻产量和品质形成影响的研究进展[J]. 中国水稻科学, 2024, 38(4): 350-363. |
| [3] | 许丹洁, 林巧霞, 李正康, 庄小倩, 凌宇, 赖美玲, 陈晓婷, 鲁国东. OsOPR10正调控水稻对稻瘟病和白叶枯病的抗性[J]. 中国水稻科学, 2024, 38(4): 364-374. |
| [4] | 候小琴, 王莹, 余贝, 符卫蒙, 奉保华, 沈煜潮, 谢杭军, 王焕然, 许用强, 武志海, 王建军, 陶龙兴, 符冠富. 黄腐酸钾提高水稻秧苗耐盐性的作用途径分析[J]. 中国水稻科学, 2024, 38(4): 409-421. |
| [5] | 吕宙, 易秉怀, 陈平平, 周文新, 唐文帮, 易镇邪. 施氮量与移栽密度对小粒型杂交水稻产量形成的影响[J]. 中国水稻科学, 2024, 38(4): 422-436. |
| [6] | 胡继杰, 胡志华, 张均华, 曹小闯, 金千瑜, 章志远, 朱练峰. 根际饱和溶解氧对水稻分蘖期光合及生长特性的影响[J]. 中国水稻科学, 2024, 38(4): 437-446. |
| [7] | 刘福祥, 甄浩洋, 彭焕, 郑刘春, 彭德良, 文艳华. 广东省水稻孢囊线虫病调查与鉴定[J]. 中国水稻科学, 2024, 38(4): 456-461. |
| [8] | 陈浩田, 秦缘, 钟笑涵, 林晨语, 秦竞航, 杨建昌, 张伟杨. 水稻根系和土壤性状与稻田甲烷排放关系的研究进展[J]. 中国水稻科学, 2024, 38(3): 233-245. |
| [9] | 缪军, 冉金晖, 徐梦彬, 卜柳冰, 王平, 梁国华, 周勇. 过量表达异三聚体G蛋白γ亚基基因RGG2提高水稻抗旱性[J]. 中国水稻科学, 2024, 38(3): 246-255. |
| [10] | 尹潇潇, 张芷菡, 颜绣莲, 廖蓉, 杨思葭, 郭岱铭, 樊晶, 赵志学, 王文明. 多个稻曲病菌效应因子的信号肽验证和表达分析[J]. 中国水稻科学, 2024, 38(3): 256-265. |
| [11] | 朱裕敬, 桂金鑫, 龚成云, 罗新阳, 石居斌, 张海清, 贺记外. 全基因组关联分析定位水稻分蘖角度QTL[J]. 中国水稻科学, 2024, 38(3): 266-276. |
| [12] | 赵艺婷, 谢可冉, 高逖, 崔克辉. 水稻分蘖期干旱锻炼对幼穗分化期高温下穗发育和产量形成的影响[J]. 中国水稻科学, 2024, 38(3): 277-289. |
| [13] | 魏倩倩, 汪玉磊, 孔海民, 徐青山, 颜玉莲, 潘林, 迟春欣, 孔亚丽, 田文昊, 朱练峰, 曹小闯, 张均华, 朱春权. 信号分子硫化氢参与硫肥缓解铝对水稻生长抑制作用的机制[J]. 中国水稻科学, 2024, 38(3): 290-302. |
| [14] | 周甜, 吴少华, 康建宏, 吴宏亮, 杨生龙, 王星强, 李昱, 黄玉峰. 不同种植模式对水稻籽粒淀粉含量及淀粉关键酶活性的影响[J]. 中国水稻科学, 2024, 38(3): 303-315. |
| [15] | 关雅琪, 鄂志国, 王磊, 申红芳. 影响中国水稻生产环节外包发展因素的实证研究:基于群体效应视角[J]. 中国水稻科学, 2024, 38(3): 324-334. |
| 阅读次数 | ||||||
|
全文 |
|
|||||
|
摘要 |
|
|||||