中国水稻科学 ›› 2025, Vol. 39 ›› Issue (1): 115-127.DOI: 10.16819/j.1001-7216.2025.240309
王晓茜1,2,3, 蔡创1,2,3, 宋练1,2,3, 周伟1,2,3, 杨雄1,3, 顾歆悦1,2,3, 朱春梧1,2,3,*( )
)
收稿日期:2024-03-18
修回日期:2024-07-14
出版日期:2025-01-10
发布日期:2025-01-14
通讯作者:
*email: cwzhu@issas.ac.cn基金资助:
WANG Xiaoxi1,2,3, CAI Chuang1,2,3, SONG Lian1,2,3, ZHOU Wei1,2,3, YANG Xiong1,3, GU Xinyue1,2,3, ZHU Chunwu1,2,3,*()
Received:2024-03-18
Revised:2024-07-14
Online:2025-01-10
Published:2025-01-14
Contact:
*email: cwzhu@issas.ac.cn摘要:
【目的】明确大气CO2浓度升高和温度升高对籼稻稻米品质的影响及其机制。【方法】采用开放式大气CO2浓度升高和温度升高(T-FACE)平台,以扬稻6号(籼稻)作为测试品种,研究大气CO2浓度升高200 μmol/mol,温度升高2 ℃(2021年为夜间-白天温升,ENDT; 2022年为白天温升,EDT)对稻米加工、外观、营养和食味品质及其相关的淀粉合成酶活性和非结构性碳水化合物含量的影响。【结果】未来大气CO2浓度和全天温度共同升高不会影响籼稻的加工品质和营养品质;使稻米直链淀粉含量降低31.57%,有助于改善食味品质。而大气CO2浓度升高或/和温度升高均降低籽粒的垩白粒率和垩白度,从而改善籼稻的外观品质。在未来大气CO2浓度和全天温度同时升高条件下,垩白粒率和垩白度分别降低了25.98%和34.82%。相关性分析结果显示,水稻籽粒垩白度与蔗糖合成酶活性和细胞壁转化酶活性正相关,与非结构性碳水化合物含量以及可溶性淀粉合成酶活性负相关。水稻籽粒垩白降低的可能机制包括:大气CO2浓度升高增加非结构性碳水化合物含量,增强可溶性淀粉合成酶活性,保证了灌浆过程充足的底物供应;温度和大气CO2浓度升高共同作用主要在灌浆后期,降低蔗糖合成酶和细胞壁转化酶活性,可能减缓了灌浆速率。【结论】在大气CO2浓度和全天温度同时升高背景下,扬稻6号水稻籽粒的垩白和直链淀粉含量降低,外观品质和食味品质得到改善。
王晓茜, 蔡创, 宋练, 周伟, 杨雄, 顾歆悦, 朱春梧. 开放式大气CO2浓度升高和温度升高对扬稻6号稻米品质的影响[J]. 中国水稻科学, 2025, 39(1): 115-127.
WANG Xiaoxi, CAI Chuang, SONG Lian, ZHOU Wei, YANG Xiong, GU Xinyue, ZHU Chunwu. Effect of Free-air CO2 Enrichment and Temperature Increase on Grain Quality of Rice Cultivar Yangdao 6[J]. Chinese Journal OF Rice Science, 2025, 39(1): 115-127.
| 年份 Year | 处理 Treatment | 糙米率 Brown rice percentage (%) | 精米率 Milled rice percentage (%) | 整精米率 Head rice percentage (%) | 垩白粒率 Chalky grain percentage (%) | 垩白度 Chalkiness degree (%) | 直链淀粉含量 Amylose content (%) | 蛋白质含量 Protein content (mg/g) |
|---|---|---|---|---|---|---|---|---|
| 2021 | Control | 79.16±0.22 c | 63.83±0.24 b | 58.68±0.38 a | 20.59±1.49 a | 5.60±0.41 a | 27.37±3.09 a | 105.79±3.87 ab |
| EC | 80.11±0.35 b | 64.85±0.61 ab | 57.01±0.25 ab | 16.01±0.88 ab | 4.28±0.28 ab | 25.77±1.51 a | 99.20±2.99 b | |
| ENDT | 80.24±0.24 b | 65.28±0.32 a | 57.64±0.61 ab | 18.88±0.84 ab | 4.78±0.19 ab | 19.01±1.03 b | 111.23±2.41 a | |
| ECNDT | 81.14±0.19 a | 65.86±0.21 a | 55.97±0.96 b | 15.24±2.49 b | 3.65±0.70 b | 18.73±0.42 b | 107.71±2.88 ab | |
| 2022 | Control | 80.28±0.24 a | 67.97±0.30 a | 59.72±1.16 a | 18.27±0.17 a | 4.26±0.22 a | 16.00±1.88 a | 100.24±2.84 a |
| EC | 80.05±0.18 a | 67.76±0.18 a | 61.86±2.90 a | 16.77±1.93 a | 3.46±0.46 ab | 14.68±1.25 a | 85.53±7.03 a | |
| EDT | 79.66±0.25 a | 67.03±0.48 a | 65.36±0.56 a | 13.94±0.91 a | 3.05±0.42 b | 17.24±2.04 a | 95.41±0.86 a | |
| ECDT | 79.51±0.27 a | 67.43±0.24 a | 63.27±0.94 a | 14.58±1.03 a | 3.07±0.32 ab | 17.22±0.71 a | 83.74±3.12 a | |
| 双因素方差分析显著性 The probability of significance of two-way ANOVA | ||||||||
| 2021 | CO2 | 0.046 | 0.161 | 0.047 | 0.050 | 0.062 | 0.678 | 0.169 |
| NDT | 0.043 | 0.165 | 0.407 | 0.048 | 0.009 | 0.037 | 0.249 | |
| CO2 × NDT | 0.914 | 0.499 | 0.985 | 0.789 | 0.823 | 0.802 | 0.554 | |
| 2022 | CO2 | 0.434 | 0.647 | 0.988 | 0.833 | 0.592 | 0.620 | 0.133 |
| DT | 0.224 | 0.293 | 0.241 | 0.052 | 0.050 | 0.035 | 0.398 | |
| CO2 × DT | 0.860 | 0.476 | 0.336 | 0.357 | 0.344 | 0.792 | 0.676 | |
| Control表示环境CO2浓度和温度,EC表示大气CO2浓度升高,ENDT表示夜间-白天温度升高,ECNDT表示大气CO2浓度升高和夜间-白天温度升高,EDT表示白天温度升高,ECDT表示大气CO2浓度升高和白天温度升高。NDT和DT分别表示夜间-白天温度和白天温度。每列不同小写字母表示各处理间的显著性差异(多重比较结果)。表中数据为平均数±标准误(n = 3)。显著性水平P < 0.05。 | ||||||||
| Control stand for ambient CO2 concentration and temperature, EC stand for elevated atmospheric CO2 concentration, ENDT stand for elevated night-time and day-time temperature, ECNDT stand for the combination of elevated atmospheric CO2 concentration and elevated night-time and day-time temperature, EDT stand for elevated day-time temperature, ECDT stand for the combination of elevated atmospheric CO2 concentration and elevated day-time temperature. NDT and DT stand for night-time and day-time temperature and day-time temperature, respectively. Different lowercase letters in a column represent significant differences among treatments (multiple comparisons). Data in the table are mean(standard errors, n = 3). Statistically significant differences (P < 0.05) are shown in the table. | ||||||||
表1 大气CO2浓度和温度升高对水稻糙米率、精米率、整精米率、垩白粒率、垩白度、直链淀粉含量和蛋白质含量的影响
Table 1. Effects of elevated atmospheric CO2 concentration and elevated temperature on rice brown rice percentage, milled rice percentage, head rice percentage, chalky grain percentage, chalkiness degree, amylose content and protein content
| 年份 Year | 处理 Treatment | 糙米率 Brown rice percentage (%) | 精米率 Milled rice percentage (%) | 整精米率 Head rice percentage (%) | 垩白粒率 Chalky grain percentage (%) | 垩白度 Chalkiness degree (%) | 直链淀粉含量 Amylose content (%) | 蛋白质含量 Protein content (mg/g) |
|---|---|---|---|---|---|---|---|---|
| 2021 | Control | 79.16±0.22 c | 63.83±0.24 b | 58.68±0.38 a | 20.59±1.49 a | 5.60±0.41 a | 27.37±3.09 a | 105.79±3.87 ab |
| EC | 80.11±0.35 b | 64.85±0.61 ab | 57.01±0.25 ab | 16.01±0.88 ab | 4.28±0.28 ab | 25.77±1.51 a | 99.20±2.99 b | |
| ENDT | 80.24±0.24 b | 65.28±0.32 a | 57.64±0.61 ab | 18.88±0.84 ab | 4.78±0.19 ab | 19.01±1.03 b | 111.23±2.41 a | |
| ECNDT | 81.14±0.19 a | 65.86±0.21 a | 55.97±0.96 b | 15.24±2.49 b | 3.65±0.70 b | 18.73±0.42 b | 107.71±2.88 ab | |
| 2022 | Control | 80.28±0.24 a | 67.97±0.30 a | 59.72±1.16 a | 18.27±0.17 a | 4.26±0.22 a | 16.00±1.88 a | 100.24±2.84 a |
| EC | 80.05±0.18 a | 67.76±0.18 a | 61.86±2.90 a | 16.77±1.93 a | 3.46±0.46 ab | 14.68±1.25 a | 85.53±7.03 a | |
| EDT | 79.66±0.25 a | 67.03±0.48 a | 65.36±0.56 a | 13.94±0.91 a | 3.05±0.42 b | 17.24±2.04 a | 95.41±0.86 a | |
| ECDT | 79.51±0.27 a | 67.43±0.24 a | 63.27±0.94 a | 14.58±1.03 a | 3.07±0.32 ab | 17.22±0.71 a | 83.74±3.12 a | |
| 双因素方差分析显著性 The probability of significance of two-way ANOVA | ||||||||
| 2021 | CO2 | 0.046 | 0.161 | 0.047 | 0.050 | 0.062 | 0.678 | 0.169 |
| NDT | 0.043 | 0.165 | 0.407 | 0.048 | 0.009 | 0.037 | 0.249 | |
| CO2 × NDT | 0.914 | 0.499 | 0.985 | 0.789 | 0.823 | 0.802 | 0.554 | |
| 2022 | CO2 | 0.434 | 0.647 | 0.988 | 0.833 | 0.592 | 0.620 | 0.133 |
| DT | 0.224 | 0.293 | 0.241 | 0.052 | 0.050 | 0.035 | 0.398 | |
| CO2 × DT | 0.860 | 0.476 | 0.336 | 0.357 | 0.344 | 0.792 | 0.676 | |
| Control表示环境CO2浓度和温度,EC表示大气CO2浓度升高,ENDT表示夜间-白天温度升高,ECNDT表示大气CO2浓度升高和夜间-白天温度升高,EDT表示白天温度升高,ECDT表示大气CO2浓度升高和白天温度升高。NDT和DT分别表示夜间-白天温度和白天温度。每列不同小写字母表示各处理间的显著性差异(多重比较结果)。表中数据为平均数±标准误(n = 3)。显著性水平P < 0.05。 | ||||||||
| Control stand for ambient CO2 concentration and temperature, EC stand for elevated atmospheric CO2 concentration, ENDT stand for elevated night-time and day-time temperature, ECNDT stand for the combination of elevated atmospheric CO2 concentration and elevated night-time and day-time temperature, EDT stand for elevated day-time temperature, ECDT stand for the combination of elevated atmospheric CO2 concentration and elevated day-time temperature. NDT and DT stand for night-time and day-time temperature and day-time temperature, respectively. Different lowercase letters in a column represent significant differences among treatments (multiple comparisons). Data in the table are mean(standard errors, n = 3). Statistically significant differences (P < 0.05) are shown in the table. | ||||||||
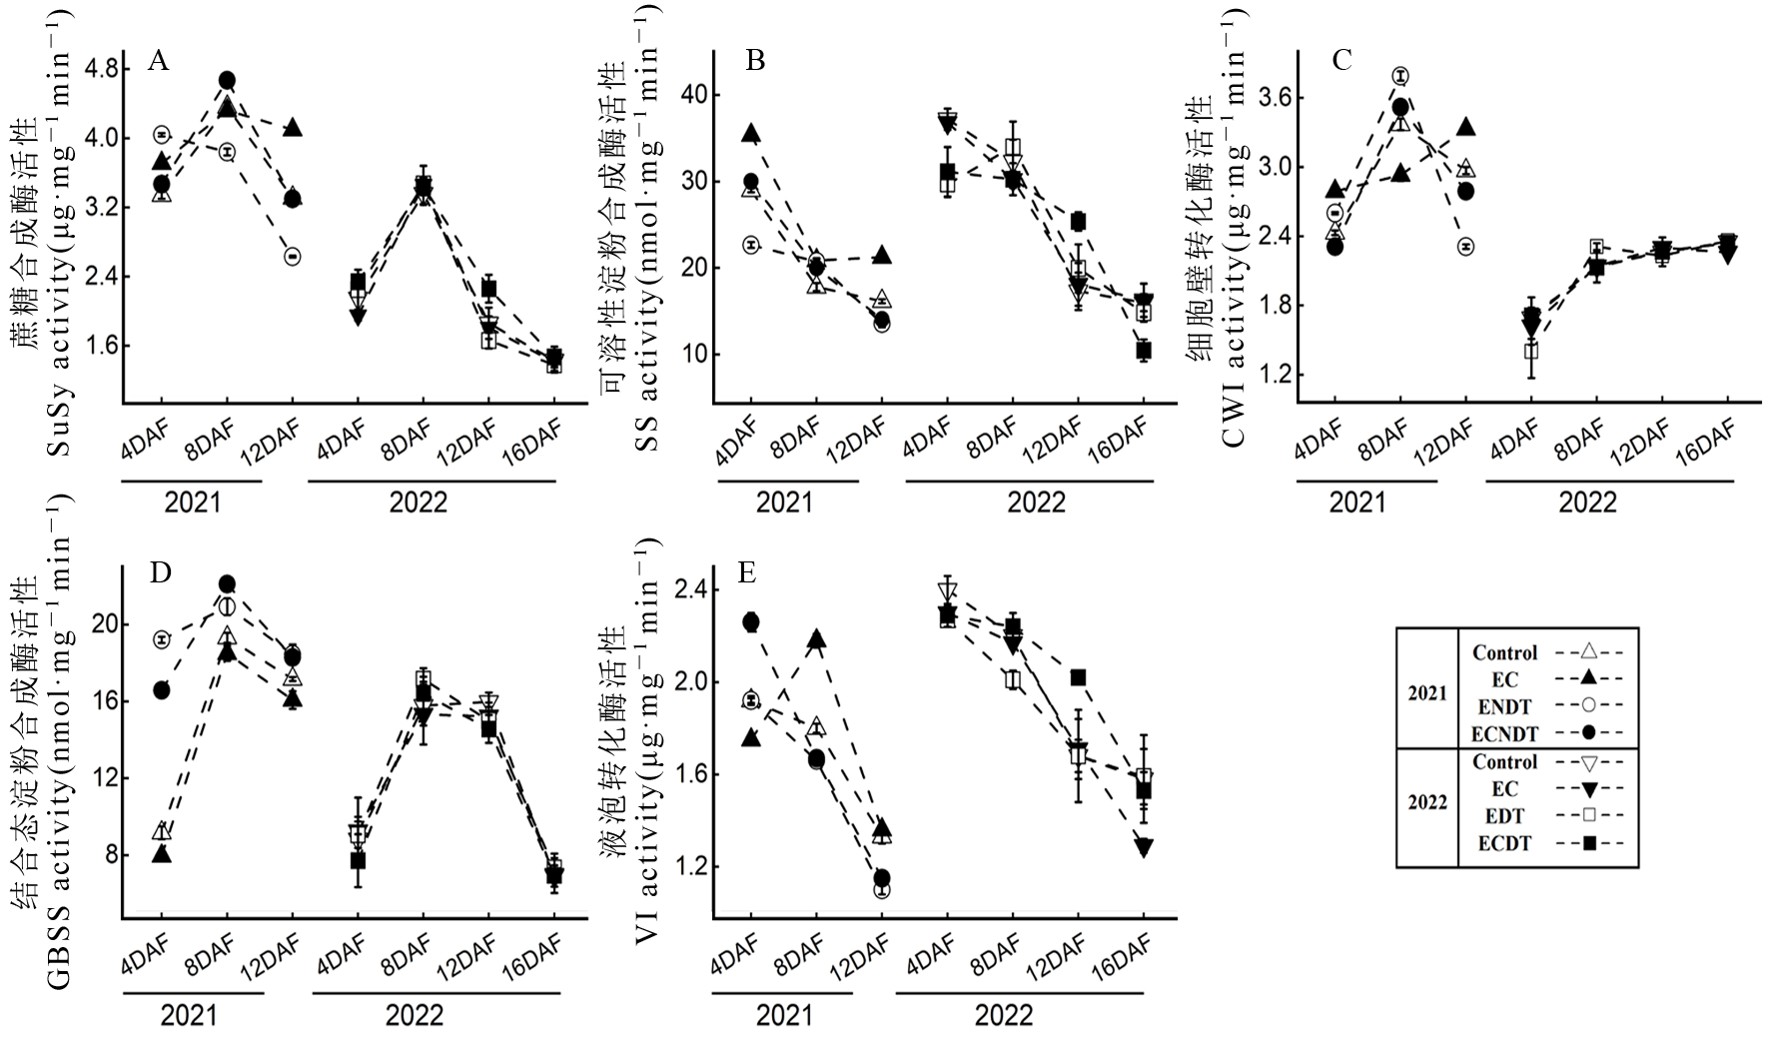
图1 大气CO2浓度升高和温度升高对开花后不同天数水稻籽粒蔗糖合成酶(A)、可溶性淀粉合成酶(B)、细胞壁转化酶(C)、结合态淀粉合成酶(D)和液泡转化酶(E)活性的影响
Fig. 1. Effects of elevated atmospheric CO2 concentration and elevated temperature on sucrose synthase(SuSy, A), starch synthase(SS, B), Cell wall invertase(CWI, C), granule-bound starch synthase(GBSS, D) and vacuolar invertase(VI, E) activities in rice grains taken on different days after flowering (DAF)
| 酶 Enzyme | 开花后天数 Days after flowering (DAF) | 2021 | 2022 | |||||
| CO2 | NDT | CO2×NDT | CO2 | DT | CO2×DT | |||
| 蔗糖合成酶SuSy | 4 | 0.171 | 0.006 | 0.011 | 0.771 | 0.279 | 0.453 | |
| 8 | 0.013 | 0.336 | 0.008 | 0.739 | 0.742 | 0.201 | ||
| 12 | 0.0002 | 0.003 | 0.421 | 0.024 | 0.511 | 0.290 | ||
| 16 | 0.569 | 0.985 | 0.594 | |||||
| 可溶性淀粉合成酶SS | 4 | 0.0005 | 0.002 | 0.330 | 0.717 | 0.036 | 0.545 | |
| 8 | 0.055 | 0.259 | 0.016 | 0.307 | 0.652 | 0.527 | ||
| 12 | 0.006 | 0.0002 | 0.049 | 0.306 | 0.258 | 0.361 | ||
| 16 | 0.032 | 0.304 | 0.100 | |||||
| 细胞壁转化酶CWI | 4 | 0.054 | 0.005 | 0.011 | 0.523 | 0.530 | 0.504 | |
| 8 | 0.002 | 0.008 | 0.074 | 0.394 | 0.267 | 0.332 | ||
| 12 | 0.017 | 0.007 | 0.021 | 0.658 | 0.718 | 0.958 | ||
| 16 | 0.097 | 0.385 | 0.014 | |||||
| 结合态淀粉合成酶GBSS | 4 | 0.030 | 0.001 | 0.046 | 0.711 | 0.566 | 0.340 | |
| 8 | 0.493 | 0.064 | 0.0001 | 0.633 | 0.151 | 0.843 | ||
| 12 | 0.087 | 0.018 | 0.496 | 0.317 | 0.532 | 0.600 | ||
| 16 | 0.643 | 0.796 | 0.636 | |||||
| 液泡转化酶VI | 4 | 0.068 | 0.012 | 0.0003 | 0.120 | 0.365 | 0.076 | |
| 8 | 0.0003 | 0.001 | 0.004 | 0.034 | 0.365 | 0.003 | ||
| 12 | 0.399 | 0.004 | 0.321 | 0.233 | 0.487 | 0.290 | ||
| 16 | 0.161 | 0.505 | 0.537 | |||||
表2 CO2和温度对开花后不同天数水稻籽粒蔗糖合成酶、可溶性淀粉合成酶、细胞壁转化酶、结合态淀粉合成酶和液泡转化酶活性影响的方差分析
Table 2. Analysis of variance of CO2 and temperature effects on SuSy, SS, CWI, GBSS and VI activities in grains at different days after flowering (DAF)
| 酶 Enzyme | 开花后天数 Days after flowering (DAF) | 2021 | 2022 | |||||
| CO2 | NDT | CO2×NDT | CO2 | DT | CO2×DT | |||
| 蔗糖合成酶SuSy | 4 | 0.171 | 0.006 | 0.011 | 0.771 | 0.279 | 0.453 | |
| 8 | 0.013 | 0.336 | 0.008 | 0.739 | 0.742 | 0.201 | ||
| 12 | 0.0002 | 0.003 | 0.421 | 0.024 | 0.511 | 0.290 | ||
| 16 | 0.569 | 0.985 | 0.594 | |||||
| 可溶性淀粉合成酶SS | 4 | 0.0005 | 0.002 | 0.330 | 0.717 | 0.036 | 0.545 | |
| 8 | 0.055 | 0.259 | 0.016 | 0.307 | 0.652 | 0.527 | ||
| 12 | 0.006 | 0.0002 | 0.049 | 0.306 | 0.258 | 0.361 | ||
| 16 | 0.032 | 0.304 | 0.100 | |||||
| 细胞壁转化酶CWI | 4 | 0.054 | 0.005 | 0.011 | 0.523 | 0.530 | 0.504 | |
| 8 | 0.002 | 0.008 | 0.074 | 0.394 | 0.267 | 0.332 | ||
| 12 | 0.017 | 0.007 | 0.021 | 0.658 | 0.718 | 0.958 | ||
| 16 | 0.097 | 0.385 | 0.014 | |||||
| 结合态淀粉合成酶GBSS | 4 | 0.030 | 0.001 | 0.046 | 0.711 | 0.566 | 0.340 | |
| 8 | 0.493 | 0.064 | 0.0001 | 0.633 | 0.151 | 0.843 | ||
| 12 | 0.087 | 0.018 | 0.496 | 0.317 | 0.532 | 0.600 | ||
| 16 | 0.643 | 0.796 | 0.636 | |||||
| 液泡转化酶VI | 4 | 0.068 | 0.012 | 0.0003 | 0.120 | 0.365 | 0.076 | |
| 8 | 0.0003 | 0.001 | 0.004 | 0.034 | 0.365 | 0.003 | ||
| 12 | 0.399 | 0.004 | 0.321 | 0.233 | 0.487 | 0.290 | ||
| 16 | 0.161 | 0.505 | 0.537 | |||||
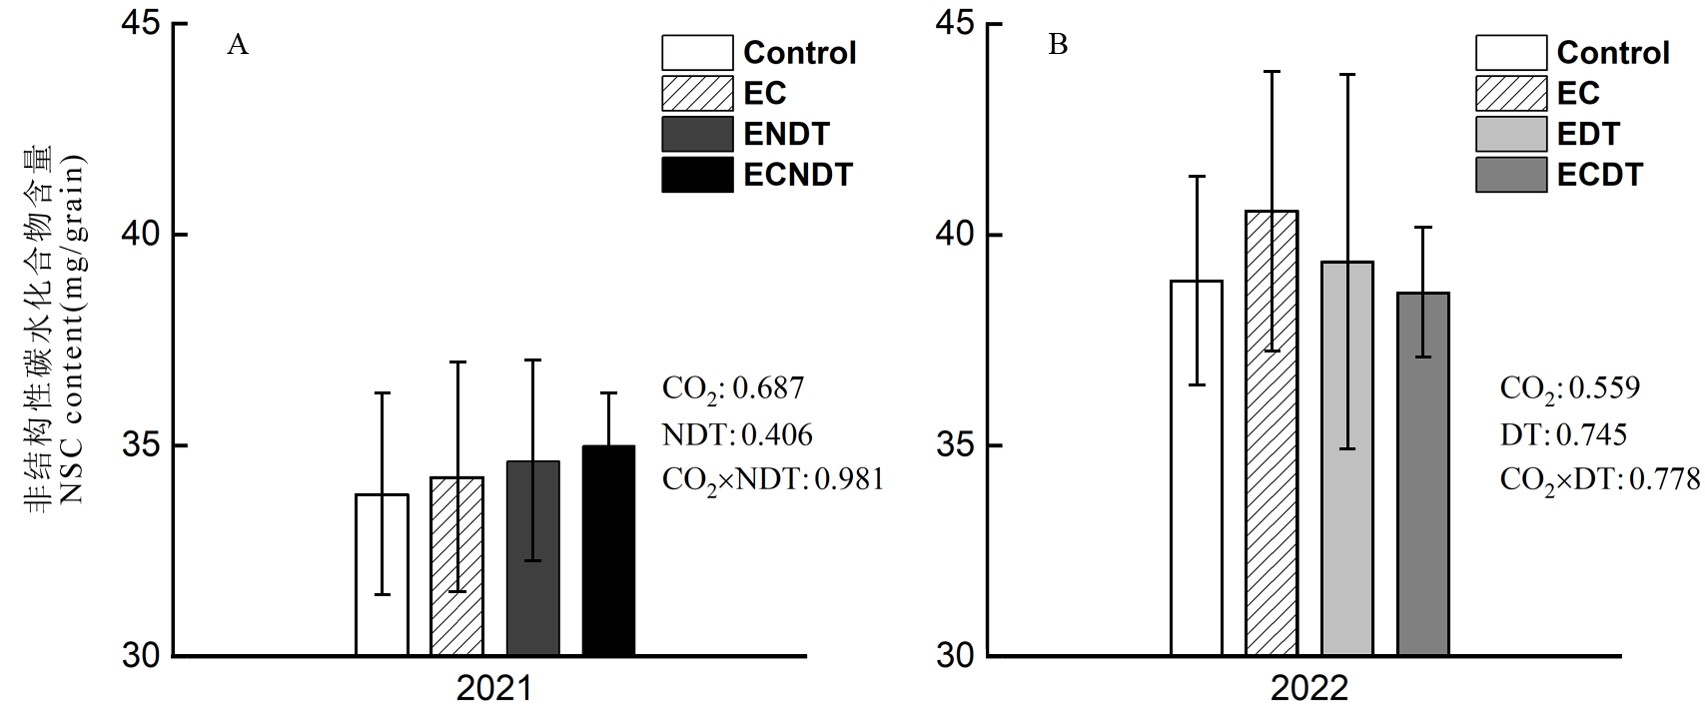
图2 大气CO2浓度升高和温度升高对2021年(A)和2022年(B)成熟期水稻籽粒中非结构性碳水化合物含量的影响
Fig. 2. Effects of elevated atmospheric CO2 concentration and elevated temperature on non-structural carbohydrates (NSC) content in rice grains taken at maturity in 2021 (A) and 2022 (B)
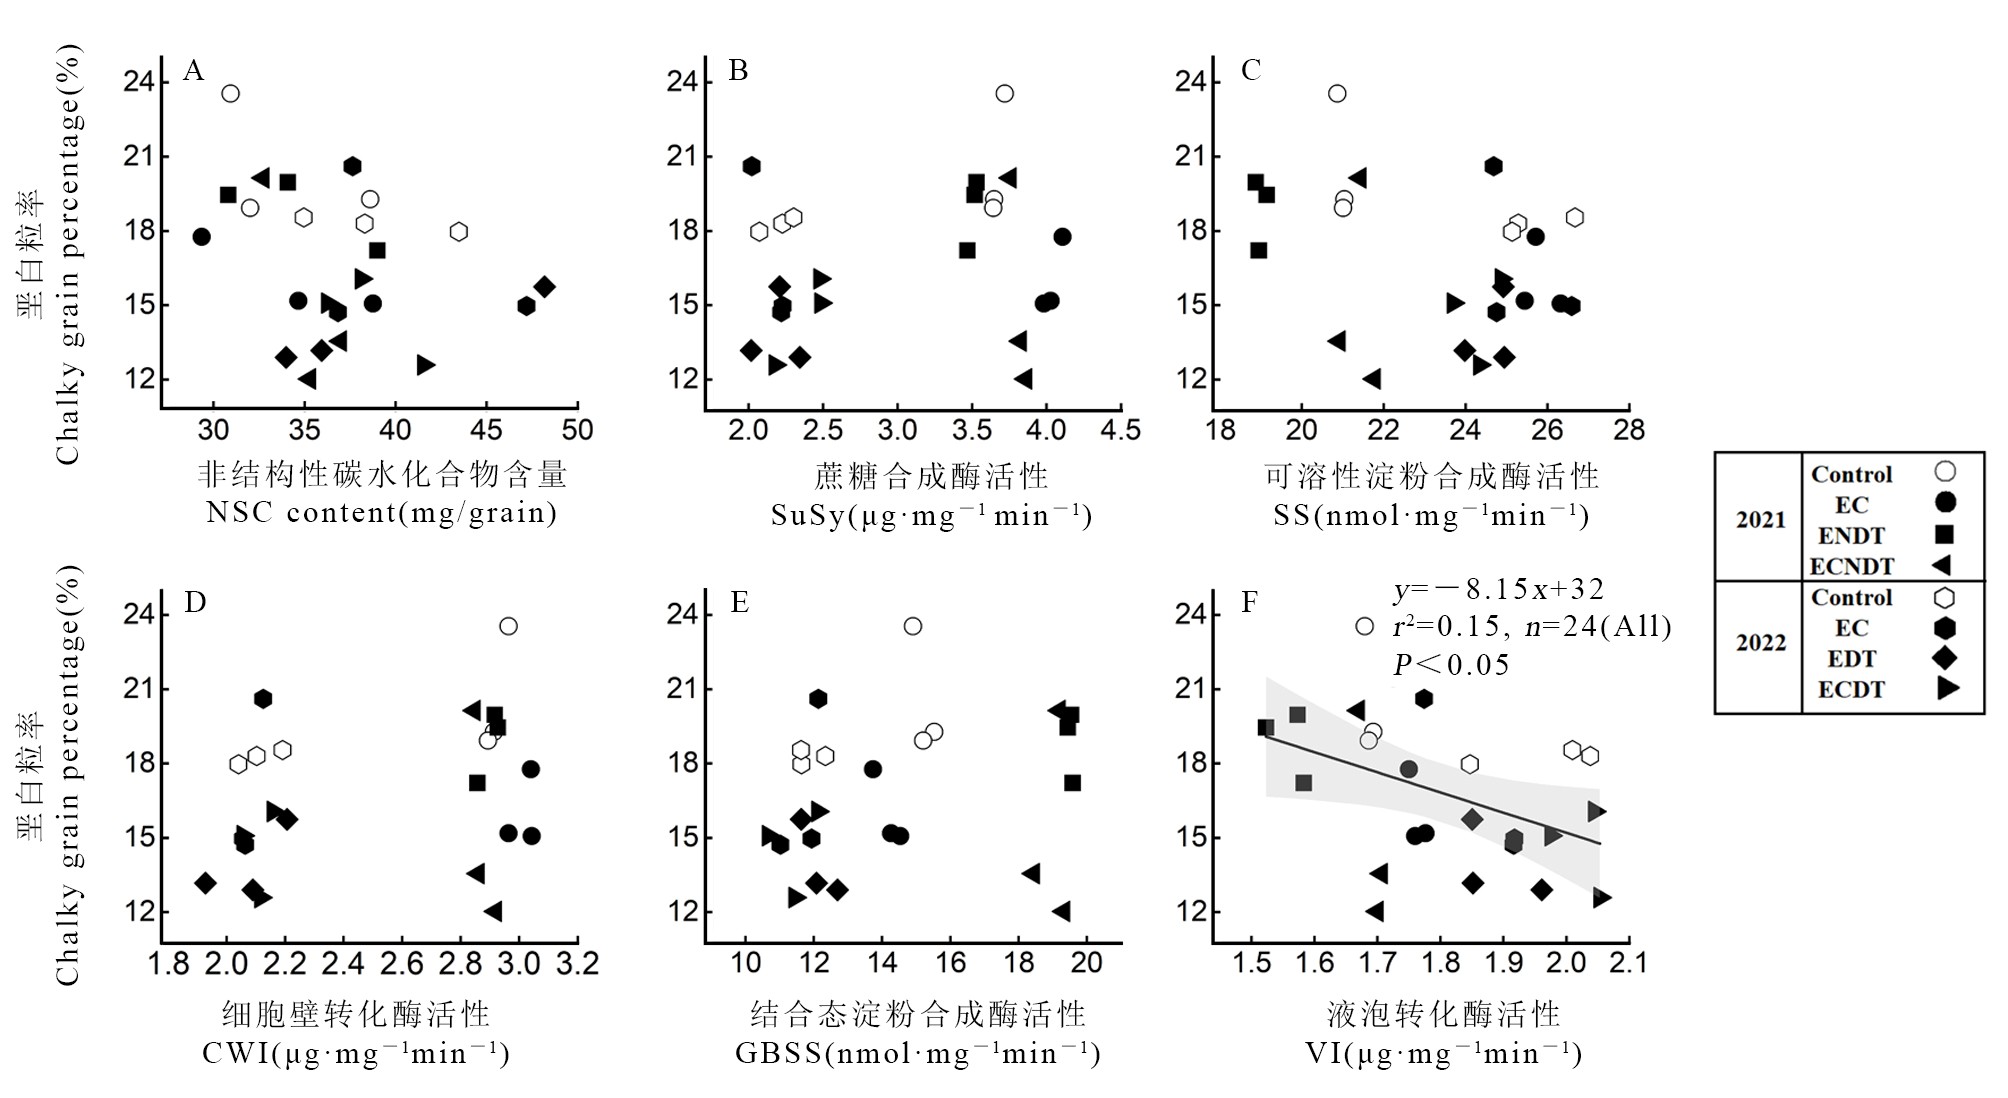
图3 垩白粒率与籽粒非结构性碳水化合物含量(A)以及蔗糖合成酶(B)、可溶性淀粉合成酶(C)、细胞壁转化酶(D)、结合态淀粉合成酶(E)和液泡转化酶(F)活性的相关关系 加粗的统计参数代表所有处理的统计结果。仅呈现统计显著性P < 0.05的线,阴影部分表示95%的置信区间。
Fig. 3. Relationships between chalky grain percentage and non-structural carbohydrates (NSC) content (A), SuSy (B), SS (C), CWI (D), GBSS (E), and VI (F) activities in rice grains Statistical parameters given in the panels are in bold if data are combined for all treatments. The line represents significant regressions (P < 0.05), and the shaded area represents 95% confidence interval.
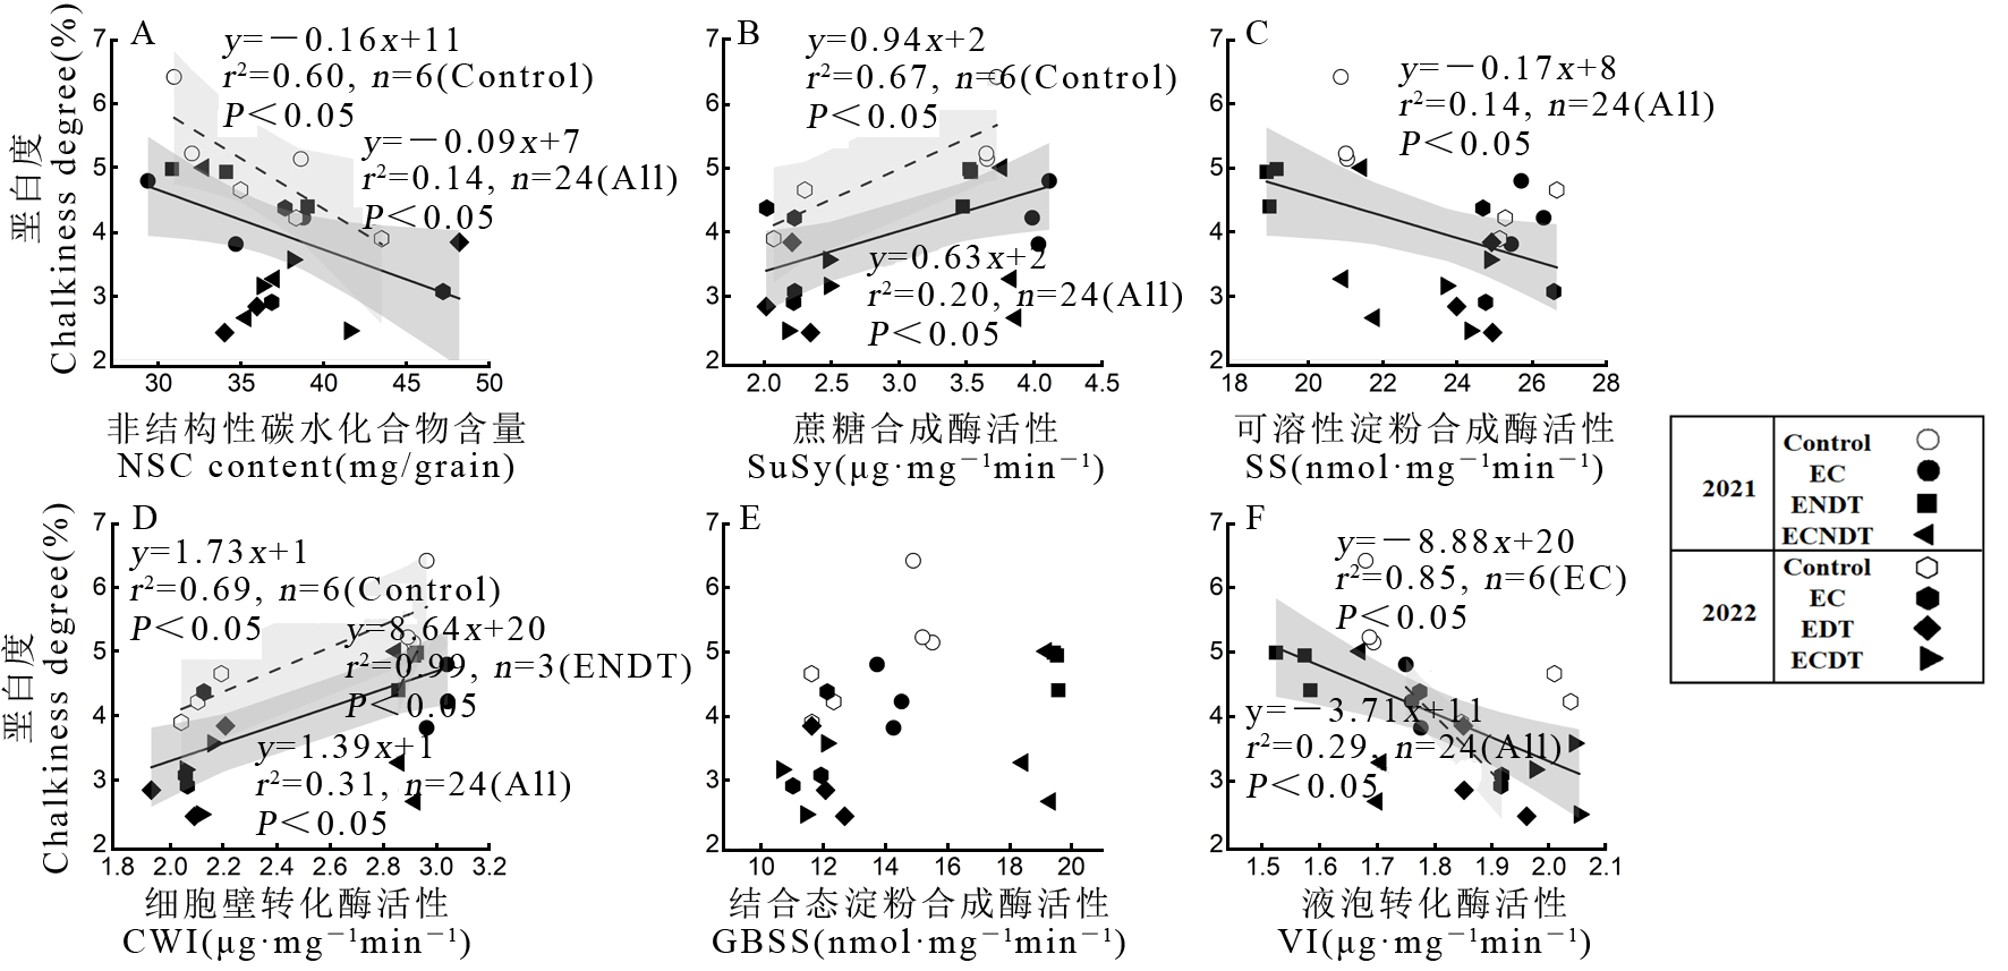
图4 垩白度与籽粒非结构性碳水化合物含量(A)以及蔗糖合成酶(B)、可溶性淀粉合成酶(C)、细胞壁转化酶(D)、结合态淀粉合成酶(E)和液泡转化酶(F)活性的相关关系 加粗的统计参数代表所有处理的统计结果,未加粗的统计参数代表各自处理的统计结果。仅呈现统计显著性P < 0.05的线,阴影部分表示95%的置信区间。
Fig. 4. Relationships between chalkiness degree and non-structural carbohydrates (NSC) content (A),and SuSy (B), SS (C), CWI (D), GBSS (E), VI (F) activities in rice grains Statistical parameters given in the panels are in bold if data are combined for all treatments, in nonbold if not. The line represents significant regressions (P < 0.05), and the shaded area represents the 95% confidence interval.
| [1] | NOAA. Carbon dioxide peaks near 420 parts per million at Mauna Loa observatory[EB/OL] 2021. https://research.noaa.gov/article/ArtMID/587/ArticleID/2764/ (accessed 19 October 2021). |
| [2] | Retallack G J, Conde G D. Deep time perspective on rising atmospheric CO2[J]. Global and Planetary Change, 2020, 189: 103177. |
| [3] | Masson-Delmotte V, Zhai P, Pirani A, Connors S L, Péan C, Berger S, Caud N, Chen Y, Goldfarb L, Gomis M I, Huang M, Leitzell K, Lonnoy E, Matthews J B R, Maycock T K, Waterfield T, Yelekçi O, Yu R, Zhou B. Summary for policymakers: Climate change 2021:The Physical Science Basis. Contribution of Working Group I to the Sixth Assessment Report of the Intergovernmental Panel on Climate Change[M/OL]. Switzerland: IPCC, 2021. |
| [4] | MacLean J, Hardy B, Hettel G. Rice Almanac, 4th edition[M]. Los Banos: International Rice Research Institute, 2013. |
| [5] | Seck P A, Diagne A, Mohanty S, Wopereis M C S. Crops that feed the world 7: Rice[J]. Food Security, 2012, 4(1): 7-24. |
| [6] | Khush G S. Strategies for increasing the yield potential of cereals: Case of rice as an example[J]. Plant Breeding, 2013, 132: 433-436. |
| [7] | Zhang L L, Zhang Z, Tao F, Luo Y C, Zhang J, Cao J. Adapting to climate change precisely through cultivars renewal for rice production across China: When, where, and what cultivars will be required[J]? Agricultural and Forest Meteorology, 2022, 316: 108856. |
| [8] | OECD/FAO. OECD-FAO Agricultural Outlook 2021-2030[M]. Paris: OECD Publishing, 2021. https://doi.org/10.1787/19428846-en. |
| [9] | Normile D. Reinventing rice to feed the world[J]. Science, 2008, 321: 330-333. |
| [10] | 国家统计局. 中国统计年鉴[M]. 北京: 中国统计出版社, 2018. |
| NBSC. Statistical Yearbook of China[M]. Beijing: China Statistics Press, 2018. (in Chinese) | |
| [11] | Chaturvedi A K, Bahuguna R N, Shah D, Pal M, Jagadish K S V. High temperature stress during flowering and grain filling offsets beneficial impact of elevated CO2 on assimilate partitioning and sink-strength in rice[J]. Scientific Reports, 2017, 7(1): 8227. |
| [12] | 王文婷. 沿江地区温光要素对优质粳稻产量与品质的影响研究[D]. 扬州: 扬州大学, 2021. |
| Wang W T. Study on the effect of temperature-light factors on the formation of quality and yield of japonica rice along the Yangtze River[D]. Yangzhou: Yangzhou University, 2021. (in Chinese with English abstract) | |
| [13] | 牛玺朝, 户少武, 杨阳, 童楷程, 景立权, 朱建国, 王余龙, 杨连新, 王云霞. 大气CO2浓度增高对不同水稻品种稻米品质的影响[J]. 中国生态农业学报, 2021, 29(3): 509-519. |
| Niu X C, Hu S W, Yang Y, Tong K C, Jing L Q, Zhu J G, Wang Y L, Yang L X, Wang Y X. Effect of CO2concentration enrichment on the grain quality of different rice varieties[J]. Chinese Journal of Eco-Agriculture, 2021, 29(3): 509-519. (in Chinese with English abstract) | |
| [14] | 杨陶陶, 邹积祥, 伍龙梅, 包晓哲, 江瑜, 张楠, 张彬. 开放式增温对华南双季稻稻米品质的影响[J]. 中国水稻科学, 2022, 37(1): 66-77. |
| Yang T T, Zou J X, Wu L M, Bao X Z, Jiang Y, Zhang N, Zhang B. Effect of free air temperature increase on grain quality of double-cropping rice in south China[J]. Chinese Journal of Rice Science, 2022, 37(1): 66-77. (in Chinese with English abstract) | |
| [15] | Hu S W, Tong K C, Chen W, Wang Y X, Wang Y L, Yang L X. Response of rice grain quality to elevated atmospheric CO2 concentration: A meta-analysis of 20-year FACE studies[J]. Field Crops Research, 2022, 284: 108562. |
| [16] | Usui Y, Sakai H, Tokida T, Nakamura H, Nakagawa H, Hasegawa T. Rice grain yield and quality responses to free-air CO2 enrichment combined with soil and water warming[J]. Global Change Biology, 2016, 22(3): 1256-1270. |
| [17] | 徐长亮, 李军营, 谢辉, 朱建国, 范桂枝, 蔡庆生. 开放式空气CO2浓度升高对稻米品质的影响[J]. 中国农学通报, 2008(9): 391-397. |
| Xu C L, Li J Y, Xie H, Zhu J G, Fan G Z, Cai Q S. Effect of free air CO2enrichment to rice quality of rice[J]. Chinese Agricultural Science Bulletin, 2008(9): 391-397. (in Chinese with English abstract) | |
| [18] | Fahad S, Hussain S, Saud S, Hassan S, Chauhan B S, Khan F, Ihsan M Z, Ullah A, Wu C, Bajwa A A, Alharby H, Amanullah, Nasim W, Shahzad B, Tanveer M, Huang J L. Responses of rapid viscoanalyzer profile and other rice grain qualities to exogenously applied plant growth regulators under high day and high night temperatures[J]. PLoS One, 2016, 11(7): e0159590. |
| [19] | Chaturvedi A K, Bahuguna R N, Pal M, Shah D, Maurya S, Jagadish K S V. Elevated CO2 and heat stress interactions affect grain yield, quality and mineral nutrient composition in rice under field conditions[J]. Field Crops Research, 2017, 206: 149-157. |
| [20] | Wei L L, Wang W L, Zhu J G, Wang Z Q, Wang J Q, Li C H. Responses of rice qualitative characteristics to elevated carbon dioxide and higher temperature: Implications for global nutrition[J]. Journal of the Science of Food and Agriculture, 2021, 101(9): 3854-3861. |
| [21] | Zhu C W, Kobayashi K, Loladze I, Zhu J G, Jiang Q, Xu X, Liu G, Seneweera S, Ebi K L, Drewnowski A, Fukagawa N K, Ziska L H. Carbon dioxide (CO2) levels this century will alter the protein, micronutrients, and vitamin content of rice grains with potential health consequences for the poorest rice-dependent countries[J]. Science Advances, 2018, 4(5): eaaq1012. |
| [22] | 王云霞, 杨连新. 水稻品质对主要气候变化因子的响应[J]. 农业环境科学学报, 2020, 39(4): 822-833. |
| Wang Y X, Yang L X. Response of rice quality to major climate change factors[J]. Journal of Agro-Environment Science, 2020, 39(4): 822-833. (in Chinese with English abstract) | |
| [23] | Usui Y, Sakai H, Tokida T, Nakamura H, Nakagawa H, Hasegawa T. Heat-tolerant rice cultivars retain grain appearance quality under free-air CO2 enrichment[J]. Rice, 2014, 7(1): 6. |
| [24] | Jagadish S V K, Murty M V R, Quick W P. Rice responses to rising temperatures: Challenges, perspectives and future directions[J]. Plant, Cell & Environment, 2015, 38(9): 1686-1698. |
| [25] | Shi W J, Yin X Y, Struik P C, Solis C, Xie F M, Schmidt R C, Huang M, Zou Y B, Ye C R, Jagadish S V K. High day- and night-time temperatures affect grain growth dynamics in contrasting rice genotypes[J]. Journal of Experimental Botany, 2017, 68(18): 5233-5245. |
| [26] | Long S P, Ainsworth E A, Leakey A D B, Nösberger J, Ort D R. Food for thought: Lower-than-expected crop yield stimulation with rising CO2 concentrations[J]. Science, 2006, 312(5782): 1918-1921. |
| [27] | Cai C, Yin X Y, He S Q, Jiang W Y, Si C F, Struik P C, Luo W H, Li G, Xie Y T, Xiong Y, Pan G X. Responses of wheat and rice to factorial combinations of ambient and elevated CO2 and temperature in FACE experiments[J]. Global Change Biology, 2016, 22(2): 856-874. |
| [28] | Cai C, Li G, Di L J, Ding Y J, Fu L, Guo X H, Struik P C, Pan G X, Li H Z, Chen W P, Luo W H, Yin X Y. The acclimation of leaf photosynthesis of wheat and rice to seasonal temperature changes in T-FACE environments[J]. Global Change Biology, 2020, 26(2): 539-556. |
| [29] | Bremner J M. Determination of nitrogen in soil by the Kjeldahl method[J]. The Journal of Agricultural Science, 1960, 55: 11-33. |
| [30] | Juliano B O. Rice in human nutrition/Prepared in collaboration with FAO. Rome: Food and Agriculture Organization of the United Nations, 1993: 162. |
| [31] | Jing L Q, Wang J, Shen S B, Wang Y X, Zhu J G, Wang Y L, Yang L X. The impact of elevated CO2 and temperature on grain quality of rice grown under open-air field conditions[J]. Journal of the Science of Food and Agriculture, 2016, 96(11): 3658-3667. |
| [32] | 钟旭华, 李太贵. 不同结实温度下稻米直链淀粉含量与千粒重的相关性研究[J]. 中国水稻科学, 1994, (2): 126-128. |
| Zhong X H, Li T G. The correlation between amylose content and grain weight under different ripening temperature[J]. Chinese Journal of Rice Science, 1994, (2): 126-128. (in Chinese with English abstract) | |
| [33] | 张国发, 王绍华, 尤娟, 王强盛, 丁艳锋, 吉志军. 结实期不同时段高温对稻米品质的影响[J]. 作物学报, 2006, 32(2): 283-287. |
| Zhang G F, Wang S H, You J, Wang Q S, Ding Y F, Ji Z J. Effect of higher temperature in different filling stages on rice qualities[J]. Acta Agronomica Sinica, 2006, 32(2): 283-287. (in Chinese with English abstract) | |
| [34] | Resurrecion A P. Effect of temperature during ripening on grain quality of rice[J]. Soil Science and Plant Nutrition, 1977, 23(1): 109-112. |
| [35] | Wang X X, Cai C, Song L, Zhou W, Yang X, Gu X Y. Responses of rice grain yield and quality to factorial combinations of ambient and elevated CO2 and temperature in T-FACE environments[J]. Field Crops Research, 2024, 309: 109328. |
| [36] | Lo P C, Hu L, Kitano H, Matsuoka M. Starch metabolism and grain chalkiness under high temperature stress[J]. National Science Review, 2016, 3(03): 280-282. |
| [37] | 王东明, 陶冶, 朱建国, 刘钢, 朱春梧. 稻米外观与加工品质对大气CO2浓度升高的响应[J]. 中国水稻科学, 2019, 33(4): 338-346. |
| Wang D M, Tao Y, Zhu J G, Liu G, Zhu C W. Responses of rice appearance and processing quality to elevated atmospheric CO2concentration[J]. Chinese Journal of Rice Science, 2019, 33(4): 338-346. (in Chinese with English abstract) | |
| [38] | 杨陶陶. 双季籼稻产量和稻米品质对增温的响应特征及其机理[D]. 南昌: 江西农业大学, 2020. |
| Yang T T. Response of indica grain yield and grain quality to experiment warming in a double rice cropping system and its mechanism[D]. Nanchang: Jiangxi Agricultural University, 2020. (in Chinese) | |
| [39] | 董文军, 田云录, 张彬, 陈金, 张卫建. 非对称性增温对水稻品种南粳44米质及关键酶活性的影响[J]. 作物学报, 2011, 37(5): 832-841. |
| Dong W J, Tian Y L, Zhang B, Chen J, Zhang W J. Effect of asymmetric warming on grain quality and related key enzymes activities for japonica rice (Nanjing 44) under FATI facility[J]. Acta Agronomica Sinica, 2011, 37(5): 832-841. (in Chinese with English abstract) | |
| [40] | Uddling J, Broberg M C, Feng Z Z, Pleijel H. Crop quality under rising atmospheric CO2[J]. Current Opinion in Plant Biology, 2018, 45: 262-267. |
| [41] | Wang Y X, Frei M. Stressed food: The impact of abiotic environmental stresses on crop quality[J]. Agriculture, Ecosystems & Environment, 2011, 141(3/4): 271-286. |
| [42] | 郑小龙, 周菁清, 白杨, 邵雅芳, 章林平, 胡培松, 魏祥进. 粳稻不同穗部籽粒的淀粉与垩白品质差异及分子机制[J]. 作物学报, 2022, 48(6): 1425-1436. |
| Zheng X L, Zhou J Q, Bai Y, Shao Y F, Zhang L P, Hu P S, Wei X J. Difference and molecular mechanism of soluble sugar metabolism and quality of different rice panicle in japonica rice[J]. Acta Agronomica Sinica, 2022, 48(6): 1425-1436. (in Chinese with English abstract) | |
| [43] | 李天, 刘奇华, 大杉立, 山岸徹, 佐佐木治人. 灌浆结实期高温对水稻籽粒蔗糖及降解酶活性的影响[J]. 中国水稻科学, 2006, (6): 626-630. |
| Li T, Liu Q H, Ohsugi R, Yamagishi T, Sasaki H. Effect of high temperature on sucrose content and sucrose-cleaving enzymes activity in rice during grain filling stage[J]. Chinese Journal of Rice Science, 2006, (6): 626-630. (in Chinese with English abstract) | |
| [44] | Xu X Y, Ren Y L, Wang C M, Zhang H, Wang F, Chen J, Liu X, Zheng T H, Cai M H, Zeng Z Q, Zhou L, Zhu S S, Tang W J, Wang J L, Guo X P, Jiang L, Chen S H, Wan J M. OsVIN2 encodes a vacuolar acid invertase that affects grain size by altering sugar metabolism in rice[J]. Plant Cell Reports, 2019, 38(10): 1273-1290. |
| [45] | 王志琴, 叶玉秀, 杨建昌, 袁莉民, 王学明, 朱庆森. 水稻灌浆期籽粒中蔗糖合成酶活性的变化与调节[J]. 作物学报, 2004, 30(7): 634-643. |
| Wang Z Q, Ye Y X, Yang J C, Yuan L M, Wang X M, Zhu Q S. Changes and regulations of sucrose synthase activity in rice grains during grain filling[J]. Acta Agronomica Sinica, 2004, 30(7): 634-643. (in Chinese with English abstract) | |
| [46] | Fei L W, Yang S C, Ma A L Y, Lunzhu C L, Wang M, Wang G J, Guo S W. Grain chalkiness is reduced by coordinating the biosynthesis of protein and starch in fragrant rice (Oryza sativa L.) grain under nitrogen fertilization[J]. Field Crops Research, 2023, 302: 109098. |
| [47] | 李天, 大杉立, 山岸徹, 佐佐木治人. 灌浆结实期弱光对水稻籽粒蔗糖及其降解酶活性的影响[J]. 作物学报, 2006, 32(6): 943-945. |
| Li T, Ohsugi R, Yamagishi T, Sasaki H. Effects of weak light on rice sucrose content and sucrose degradation enzyme activities at grain-filling stage[J]. Acta Agronomica Sinica, 2006, 32(6): 943-945. (in Chinese with English abstract) | |
| [48] | Jin S K, Xu L N, Leng Y J, Zhang M Q, Yang Q Q, Wang S L, Jia S W, Song T, Wang R A, Tao T, Liu Q Q, Cai X L, Gao J P. The OsNAC24-OsNAP protein complex activates OsGBSSI and OsSBEI expression to fine-tune starch biosynthesis in rice endosperm[J]. Plant Biotechnology Journal, 2023, 21(11): 2224-2240. |
| [49] | Irshad A, Guo H J, Rehman S U, Wang X Q, Wang C J, Raza A, Zhou C Y, Li Y T, Liu L X. Soluble starch synthase enzymes in cereals: an updated review[J]. Agronomy, 2021, 11(10): 1983. |
| [50] | Guo C C, Zhang L, Jiang P, Yang Z Y, Chen Z K, Xu F X, Guo X Y, Sun Y J, Ma J. Grain chalkiness is decreased by balancing the synthesis of protein and starch in hybrid indica rice grains under nitrogen fertilization[J]. Foods, 2024, 13(6): 855. |
| [51] | Su J C. Starch synthesis and grain filling in rice[J]. Developments in Crop Science, 2000, 26: 107-124. |
| [52] | Jing L Q, Chen C, Lu Q, Wang Y X, Zhu J G, Lai S K, Wang Y L, Yang L X. How do elevated atmosphere CO2 and temperature alter the physiochemical properties of starch granules and rice taste?[J]. Science of the Total Environment, 2021, 766: 142592. |
| [53] | Bahuguna R N, Solis C A, Shi W J, Jagadish K S V. Post-flowering night respiration and altered sink activity account for high night temperature-induced grain yield and quality loss in rice (Oryza sativa L.)[J]. Physiologia Plantarum, 2017, 159(1): 59-73. |
| [54] | Impa S M, Raju B, Hein N T, Sandhu J, Vara Prasad P V, Walia H, Jagadish S V K. High night temperature effects on wheat and rice: Current status and way forward[J]. Plant, Cell & Environment, 2021, 44(7): 2049-2065. |
| [1] | 邵雅芳, 朱大伟, 郑欣, 牟仁祥, 章林平, 陈铭学. 2002−2022长三角地区粳稻品质发展状况和地域差异性分析 [J]. 中国水稻科学, 2025, 39(2): 264-276. |
| [2] | 杜彦修, 孙文玉, 袁泽科, 张倩倩, 李富豪, 李俊周, 孙红正. 利用QTL-Seq结合分子标记定位粳稻垩白粒率控制位点qChalk8[J]. 中国水稻科学, 2024, 38(6): 665-671. |
| [3] | 吴子牛, 何丽梅, 熊莹, 陈凯瑞, 杨志远, 孙永健, 吕旭, 马均. 氮素穗肥对杂交籼稻籽粒灌浆影响及其与淀粉合成关键酶活性间关系[J]. 中国水稻科学, 2024, 38(1): 48-56. |
| [4] | 姚姝, 张亚东, 路凯, 王才林. 水稻可溶性淀粉合成酶基因SSⅡa和SSⅢa的功能、等位变异及其互作研究进展[J]. 中国水稻科学, 2022, 36(3): 227-236. |
| [5] | 姚姝, 张亚东, 刘燕清, 赵春芳, 周丽慧, 陈涛, 赵庆勇, 朱镇, Balakrishna PILLAY, 王才林. Wxmp基因背景下可溶性淀粉合成酶基因SSⅡa和去分支酶基因PUL对水稻蒸煮食味品质的影响[J]. 中国水稻科学, 2020, 34(3): 217-227. |
| [6] | 曹志斌, 李瑶, 曾博虹, 毛凌华, 蔡耀辉, 吴晓峰, 袁林峰. 非洲栽培稻垩白粒率耐热性QTL的定位[J]. 中国水稻科学, 2020, 34(2): 135-142. |
| [7] | 张习春, 鲁菲菲, 吕育松, 罗荣剑, 焦桂爱, 邬亚文, 唐绍清, 胡培松, 魏祥进. 两个垩白突变体的鉴定及突变基因的图位克隆[J]. 中国水稻科学, 2017, 31(6): 568-579. |
| [8] | 张桂莲, 廖斌, 唐文帮, 陈立云, 肖应辉. 稻米垩白性状对高温耐性的QTL分析[J]. 中国水稻科学, 2017, 31(3): 257-264. |
| [9] | 高方远1,#,邱玲1,2,# ,陆贤军1 ,任鄄胜1 ,吴贤婷1 ,任光俊1 ,曾礼华2,*. 杂交籼稻骨干保持系岗46B稻谷粒形及垩白的QTL分析[J]. 中国水稻科学, 2014, 28(3): 235-242. |
| [10] | 曲莹,金正勋*,刘海英,徐振华,朱立楠,郑冠龙,朱方旭,张忠臣. 粳稻杂种后代胚乳可溶性淀粉合成酶及同工型基因表达特性分析[J]. 中国水稻科学, 2014, 28(1): 23-31. |
| [11] | 杨亚春 ,倪大虎,宋丰顺,李泽福,易成新,杨剑波,. 不同生态地点下稻米外观品质性状的QTL定位分析 [J]. 中国水稻科学, 2011, 25(1): 43-51 . |
| [12] | 黎毛毛,徐 磊,任军芳,曹桂兰,余丽琴,高熙宗,贺浩华韩龙植,. 粳稻垩白性状的QTL检测[J]. 中国水稻科学, 2009, 23(4): 371-376 . |
| [13] | 李刚邓其明,李双成,王世全,李 平,. 稻米淀粉RVA谱特征与品质性状的相关性[J]. 中国水稻科学, 2009, 23(1): 99-99~102 . |
| [14] | 张玲,谢崇华,李伟,杨国涛. 氮钾对杂交水稻B优827籽粒淀粉含量及淀粉合成酶活性的影响[J]. 中国水稻科学, 2008, 22(5): 551-554 . |
| [15] | 韦存虚,张军,周卫东,陈义芳,刘巧泉,. 水稻胚乳淀粉体被膜的降解和复粒淀粉粒概念的探讨[J]. 中国水稻科学, 2008, 22(4): 377-384 . |
| 阅读次数 | ||||||
|
全文 |
|
|||||
|
摘要 |
|
|||||